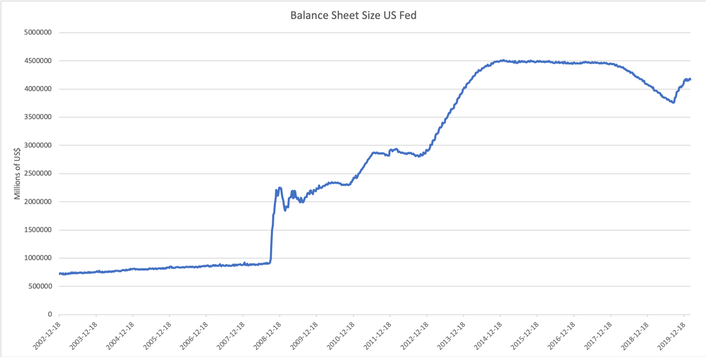
After the Great Financial Crisis (GFC) the US Federal Reserve implemented measures to spur growth in the then sputtering engine of the US economy. These measures mainly revolved around implementing a multi-phased quantitative easing program which followed the steps taken in the Great Depression of the 1930s and Japan in the 1990s – though, over time, the program undertaken after the GFC far exceeded previous programs in terms of expansion of the central bank’s balance sheet.
As can be seen in the graphic, it took the FED less than ten years to grow its balance sheet by more than three trillion dollars to roughly 4.1 trillion dollars today. In terms of GDP, this meant a growth from about 6% before the crisis to about 25% at its height in 2014 to shrinking it to roughly 17% towards the end of last year. During this program, markets became more and more reliant on monetary stimulus through open market operations by the Federal Open Market Committee (FOMC) and its counterparts within other central banks around the world, up to a point where market prices and relationships might be distorted by now – according to the Bank for International Settlements (BIS). With the increase in financial assets held by the Fed the questions regarding second and third-order consequences arose.
As can be seen in the graphic, it took the FED less than ten years to grow its balance sheet by more than three trillion dollars to roughly 4.1 trillion dollars today. In terms of GDP, this meant a growth from about 6% before the crisis to about 25% at its height in 2014 to shrinking it to roughly 17% towards the end of last year. During this program, markets became more and more reliant on monetary stimulus through open market operations by the Federal Open Market Committee (FOMC) and its counterparts within other central banks around the world, up to a point where market prices and relationships might be distorted by now – according to the Bank for International Settlements (BIS). With the increase in financial assets held by the Fed the questions regarding second and third-order consequences arose.
Most importantly, market participants and regulators waited for answers on how a deep-pocketed buyer like the Fed would influence the modern financial systems. What was going to happen to employment, price stability and long-term interest rates in the long run? Undoubtedly the main concerns in the Fed’s mandate to promote stability and growth in the United States. Furthermore, would the Fed return to a lean balance sheet – the way it was before the crisis, and if so, how would the balance sheet be unwound?
Like most scholars and practitioners, we can’t look into the future here at BSCM, but what we can do is look at historical precedent, to get an idea of the underlying forces that might be at play. Therefore, we want to have a look at what happened in the past when central banks increased their balance sheets significantly and how they acted subsequently.
Currently, the Fed’s balance sheet stands at roughly 20% of US GDP, as it started growing again due to the implementation of the standing repo facility at the end of the year. Reading the last semi-annual report to the congress it becomes clear that currently there are no intentions of shrinking the balance sheet anytime soon, but rather keep it at a constant level compared to the economy’s output. Therefore, in the foreseeable future, the Central Bank will continue to renew Treasury Bonds and Notes that reach the end of their lifecycle. In fact, as a recent research paper by the IFO institute points out, seldom did banks decrease their balance sheets by selling assets in the open markets.
The best example for a balance sheet expansion of the current magnitude can be drawn from monetary policy during World War II when the Fed flanked White House efforts to finance wartime spending by intervening on the open market to stabilize supply and demand for government debt. After the war, the central bank still increased its total assets, but at a slower rate than GDP growth. Over time, and with the help of a massive GDP expansion following World War II, this led to a decrease in balance sheet size in relation to GDP, slowly softening the Fed’s grip on economic activity. This trend of massive expansion and a subsequent reduction in central bank assets relative to GDP also occurred in other countries, though for some of them unwinding their balance sheets took until the 60s. This is mainly due to the fact that all of them stuck to the Fed’s approach, but not all of them had a tailwind from a broad economic expansion. In fact, there is only limited precedent for cases in which central banks nominally decreased their assets and they only ever did so through the maturity structure of the portfolio. The IFO report highlights also, that for most periods of balance sheet contraction, GDP and equity markets showed subpar growth while for most of the observed periods inflation was also somewhat muted. Hence, it might be beneficial to reduce Balance Sheet Size/GDP gradually, in order not to disturb economic activity.
Looking at history makes it clear that recent expansionary monetary policy is novel in terms of size and leaves open many questions. Nevertheless, taking a step back and looking at other times when the financial markets were flushed with central bank money it becomes clear that a return to lean balance sheets will eventually come and that this return will most likely be gradual. This is not to say that history can’t change but, considering the implications of decreasing the influence of monetary policy on the real economy in the past, it would be hardly possible to take a swifter approach without doing damage to economic activity.
Tobias Schmidt
