Brexit has not happened yet, but we have been talking about it for ages. At the moment, previsions about what will happen next are mere speculations, and even the well-informed struggle understanding the dynamics of the exit process. With all this uncertainty, what we can do is analyzing and using data from the day of the referendum until now.
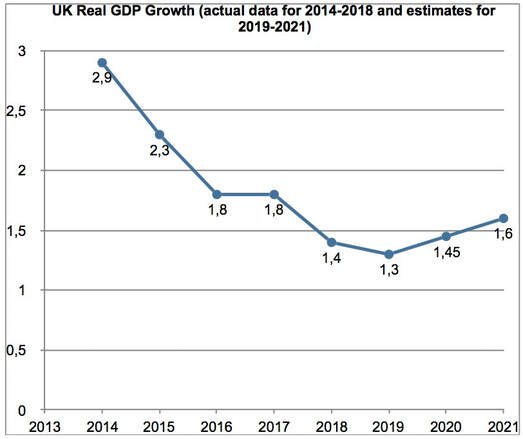
During almost three years, UK has had its up and downs. The first indicator that we are going to use is the most important one: United Kingdom real GDP. From the graph below we can see that the annual growth rate since the referendum has almost halved. This data cannot provide us with a full and comprehensive picture, but we can easily read from the graph that there has been a sudden decrease in UK growth.
During almost three years, UK has had its up and downs. The first indicator that we are going to use is the most important one: United Kingdom real GDP. From the graph below we can see that the annual growth rate since the referendum has almost halved. This data cannot provide us with a full and comprehensive picture, but we can easily read from the graph that there has been a sudden decrease in UK growth.
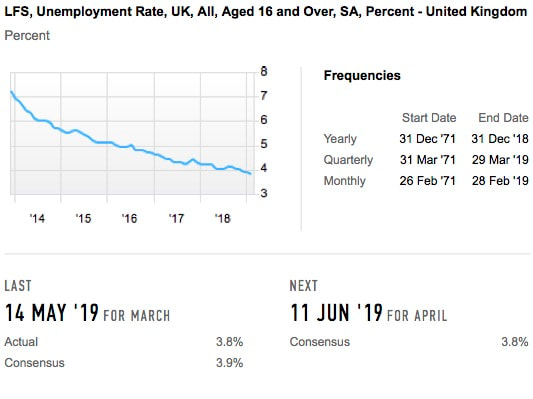
Nevertheless, the unemployment rate has plummeted at the lowest level in more than 50 years (lower than 4%). This can seem like a good sign, and politicians around Europe, who would prefer to follow in the UK’s footsteps and see their country outside of the Union, are selling this data as a great victory for the Brexit process. However, this is just a symptom which is easily explained by the decreasing salaries that are nowadays lower than in 2008 in UK, even if its GDP has been increasing throughout these years. Therefore, as suggested by basic economics, with an increase of GDP and lower (real) salaries, we obtain a gradual absorption of the unemployed population.
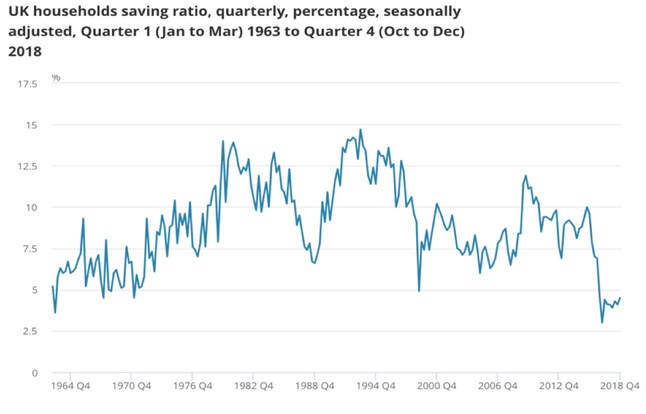
With these data in mind we then analyze another important indicator of UK economic health: the level of household debt, which has been increasing throughout the last years and it has recently reached a new record. British families are now net borrowers, and they have been such since the Brexit referendum. As it is possible to check through the data provided in the third graph, household savings have been decreasing steadily while consumption has remained equal. This is easily correlated with lower real salaries. It’s easy to understand the fact that if we have less money than before and we want to maintain the same level of consumption, we have to borrow more.
However, debt is not always the same. In fact, some debts can be more negative indicators than others. For example, the surge in personal debt (such as credit cards and car debt) signals a clear necessity to increase, in the short term, purchasing power in order to meet the needs of daily life. Moreover, the increase in the amount of debt is not just limited to the personal sphere of the economy: corporate debt has been increasing as well. Indeed, all three sectors of English economy depend significantly on borrowing, which has reached new peaks recently. Therefore, if we will ever see an actual “Brexit”, UK won’t be in the best position to negotiate, since both its individuals and its corporations are net borrowers with respect to the rest of the world, especially Europe.
Pietro Rosci
Article made possible by FactSet
Pietro Rosci
Article made possible by FactSet


