Hong Kong and Singapore, the two Asian financial hubs and among the most international cities in the world, have something in common that goes beyond their geography and culture: astonishingly high property prices. When house values increase, it is usually good for the economy as a whole and for the pockets of homeowners. But when prices gets too high, they may cause major disruption. People cannot afford to own a house, nor to rent a decent one, as their salaries are just not enough. There are no places in the world where housing is so high compared with the average salary. In an hyphotetical rank of housing affordability, if Singapore can be ranked as “very low”, then Hong Kong is “dangerously low”. Resentment against the government and those who are accused of intensifying the trend in prices (namely, Chinese investors) is growing among the population. Hong Kong real estate prices are just crazy, and a new record has been freshly established in May 2017: Henderson Land, a developer, paid US$ 3 billion for an old five-storey car park located in Central, the city’s business district. Once fully developed, the piece of land will host 43,200 square meters of space. Henderson paid almost €62,000 per square meter, excluding construction costs. This is the world’s record for a real estate sale.
The table shows rental prices, buying prices and average salaries in Hong Kong, Singapore, Milan and New York. New York tops the list with respect to absolute rental prices, but once salaries are added to the big picture, it is comparable to Milan and Singapore. Hong Kong is the most expensive city, particularly for a slightly bigger apartment: while in the other cities the rent for a 3 bedrooms apartment nears the average salary, in Hong Kong it is 50% higher. That is one reason why Hong Kongers live in very tiny apartments. What is stunning is the relative low rental prices compared to buying prices in Singapore, and the reason will be explained later on. New York is to be considered cheap for someone willing to buy, while Hong Kong, again, tops the list.
The table shows rental prices, buying prices and average salaries in Hong Kong, Singapore, Milan and New York. New York tops the list with respect to absolute rental prices, but once salaries are added to the big picture, it is comparable to Milan and Singapore. Hong Kong is the most expensive city, particularly for a slightly bigger apartment: while in the other cities the rent for a 3 bedrooms apartment nears the average salary, in Hong Kong it is 50% higher. That is one reason why Hong Kongers live in very tiny apartments. What is stunning is the relative low rental prices compared to buying prices in Singapore, and the reason will be explained later on. New York is to be considered cheap for someone willing to buy, while Hong Kong, again, tops the list.
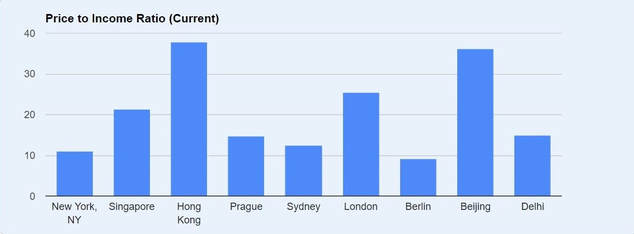
The following chart by Trading Economics might help define in graphic terms what is meant by “unaffordable housing market”. The price per square meter is compared to the average income, resulting in how many years you have to work to afford to buy a house. New York is pretty cheap, you only need to work 11 years. Singapore is more expensive, almost as costly as London, with 21 years on average. And again, Hong Kong dominates the others: 38 years of work are needed if you want to own a house. You have the chance to buy a house just before you retire, if you saved as much as you could for your whole life, if you never stopped working, if you always lived in the streets; since those 38 years are computed using your gross salary before basic expenses, the rent you pay while striving for your goal is not included in the computations [1].
Both Singapore’s and Hong Kong’s banks are not scared to offer mortgages to their clients. Prices always increase, marking astonishing returns. There is no reason to stop lending when prices can only go up. But the main drivers are not financial institutions or excessively low interest rates.
One driver is the attractiveness of the two cities compared to their neighbors in South-East Asia: a stable economy, relative freedom to speak and to act, a developed welfare state, good education and healthcare systems, international work opportunities and direct contact with the Western culture. Together with the small land availability because of the size of the territories, this led to very high population densities, with Hong Kong’s Mong Kok district topping the list of the highest densely populated place in the world, with over 130,000 people per squared km.
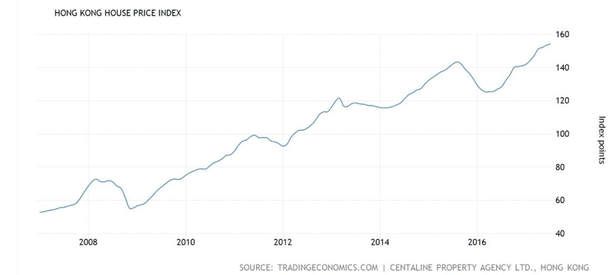
Hong Kong house prices increased 176% in the last 10 years. In the last 3 years, prices marked a “meagre” +30%, considering that there was a 13% fall in value in the second half of 2015 that was swiftly recovered. The price does not depend on families or immigrants buying a house, something bigger is at stake: the Mainland. The Mainland is not a popular term in the West, but is more so in Hong Kong. Given that the city-state is an island, Hong Kongers call the rest of China “Mainland”. From there come the goods and the evils for the city.
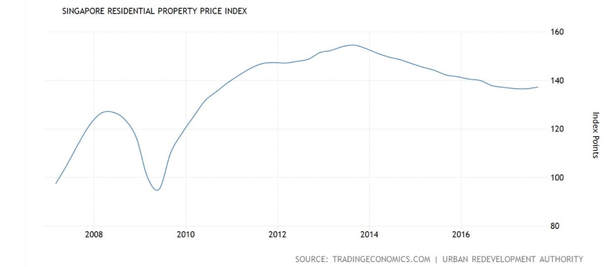
Singapore tells a different story. There are similarities, such as a rapid increase in prices prior to 2008 and fast recovery after 2008 financial crisis. After 2013, the two cities started to diverge: Singapore house prices are declining ever since, slowly but resolutely. There have been a few calls from analyst and investors in the last couple of years, predicting that a rebound was near. Time proved them to be wrong. Singapore experiences a 40% gain since the peak before the financial crisis, a healthy growth pace over a 10 years horizon that many cities experiences in the West too. The number is due to a 12% decrease in prices in the last 3 years, otherwise the figure would have been higher than just 40%.
Why is there a difference in the two trends? Singapore is experiencing slightly higher GDP growth rates, quality of life is better by any index and it is in the middle of South-East Asia, a region that in the last couple of years outpaced China for economic growth. One could have reasonably expected stronger price gains in Singapore or at least a similar path. Both cities governments take this a serious issue for their citizens and they are trying to bring prices down. But three factors concur in explaining why Singapore curbed prices and Hong Kong could not: geography, the Mainland and public housing.
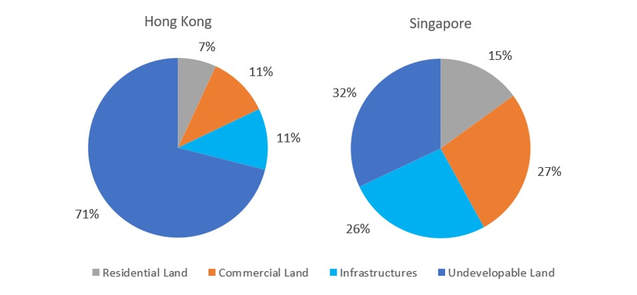
First of all, both cities are small. You can easily cross Hong Kong, 5 million people excluding villages in the countryside, from one side to the other in less than 40 minutes by MTR, the underground system, including the crossing of the sea channel that separates the island from the mainland. The same applies to Singapore, but there is a crucial difference between the two: land usage. Hong Kong is made up of mountains and small islands, Singapore is flat land. Thus, it does not surprise that only 28% of land is developable in Hong Kong, with just 7% assigned to residential housing, according to the Hong Kong Planning Department. Hong Kongers are very proud of their natural parks, which covers more than 40% of the territory, and an expansion of the buildings in those areas is completely unthinkable. On the contrary, Singapore’s developable land reaches 70%, of which 14% is assigned to residential housing, according to data provided by Singapore Ministry of National Development. While Singapore can deal with increased housing demand, Hong Kong finds itself in a difficult position.
Secondly, the Mainland. China is closer to Hong Kong than to Singapore, and although Chinese buyers are not shy to invest abroad, Hong Kong is just too convenient to be ignored. One of the biggest fear of Chinese investors, especially in the past two years, is a sudden devaluation of the renminbi, therefore there is always demand for safe assets in foreign currency. Real estate is among the safest asset class, Hong Kong and Singapore both have their own independent currency, track record for prices is astonishing and there is no preconception towards Chinese investors. Where else should investors go? However, geographical – and cultural – distance matters. Hong Kong has always been the link between China and the West, even though its role is diminishing now that China is opening to the outside world. The city is China’s first choice for investing in foreign currency, trumping Singapore, as shown by inflows of Chinese money: in 2016, Chinese companies and individuals invested US$5.2 billion in completed properties and undeveloped land in Hong Kong, compared to only US$600 million in Singapore, based on figures from Real Capital Analytics. If one believes in modern economic theory, money inflows in Hong Kong must influence the market and they are too large, with many political risks, to be stopped.
These two factors might suffice to explain the divergence in Hong Kong and Singapore prices, after all. But one should question why prices in Singapore suddenly started to decrease. That’s not a bubble burst, that’s too constant to be market driven. The fall in Hong Kong prices in 2015 was market driven: a sudden backlash following China stock market crash in the summer due to – almost – forgotten fears of sluggish GDP growth and a debt bubble. The impact on Hong Kong was relevant, as total retail spending in the city, mainly driven by Chinese tourists, plunged 8% in the last 2 years. But if Chinese individuals stopped spending relentlessly, investors invest even more in Hong Kong to diversify from the Mainland, notwithstanding currency controls imposed by the Chinese government. And property prices just tapped a record high. Singapore, which has traditionally been an investment destination for large investors only, not by Chinese individuals, did not suffer a large setback in 2015. The answer to Singapore declining trend is policymaking.
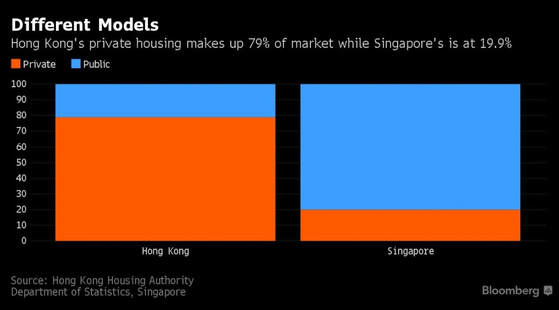
Both cities applied the same policies, with a stamp duty for foreign buyers that reaches 30% of the house value – compared to 18% in Singapore – in Hong Kong. But the effective policy adopted by the Singaporean government is public housing. Singapore’s market is dominated by public housing, while Hong Kong is the reverse. That gives Singapore an additional powerful tool to keep a tight lid on prices.
This is why rental prices in Singapore are very low compared to buying prices: the State cools them off. In Singapore the average person can afford to rent a house. Public houses are not luxurious, but they do not resemble the (bad) Western idea of public housing. They are sprawled all around the city, not clustered to create any sort of ghetto, and they are decent. If you want to step up, then you must open your wallet and go private. But it is not strictly necessary to live well. Hong Kong is quite different: public housing is scarce, places are limited compared to demand and there is a long waiting list. Further, public housing complexes do not have a good reputation, just like in the West. Due to the shortage of land, it is not easy for the government to ramp up construction of public complexes. Slowly, public institutions are expanding them, but demand from Mainland investors is stronger than ever, making efforts ineffective.
Singapore was capable to curb prices as the market reached the threshold after which switching from public to private housing is just not worth it, thus naturally capping demand from local citizens, especially considering the recent slowdown in economic growth. Eventually, Singapore prices will start to increase again, but the striking growth rates of the 2000s seem to be a thing of the past. The situation in Hong Kong is different, as demand growth will not probably decrease anytime soon. Policymaking firepower is restricted, as stopping Chinese inflows, a move not welcomed by the powerful neighbor, is not an option for the government. Investors are confident that growth will continue, angering citizens and companies. Some investment banks and small hedge funds moved out from the Central business district because of high rent prices and they were substituted for moneyed Chinese businesses, willing to pay a premium for the sake of having an office in Hong Kong. In the long run, the price trend is not sustainable, as China cannot grow forever at today’s rates and citizens will need to find a house somehow. But for the moment, Hong Kongers should put their soul to rest and save again as much as they can from their salary.
Corrado Valsecchi
[1] Price to Income Ratio is calculated as 1.5*annual average net salary (assuming 2 working people in the household, with only 50% of women employed), the median apartment size is 90 square meters and the average square meter price is computed among both city center and outside the city center.
[1] Price to Income Ratio is calculated as 1.5*annual average net salary (assuming 2 working people in the household, with only 50% of women employed), the median apartment size is 90 square meters and the average square meter price is computed among both city center and outside the city center.

