The coronavirus pandemic is a terrible issue that is affecting national and private health systems across the world: the number of deaths is continuously increasing and intensive care units are running out. On the other side, there are horrible economic news, which imply solvency and liquidity problems for many firms and the unemployment rate spiking in U.S. and Canada. Fluctuations in the equity stock market clearly reflects the uncertainty and the approaching recession, providing also many insights to investors.
The VIX Index, commonly referred as the “Fear Index”, is the premier benchmark for U.S. stock market volatility. It measures 30-day expected volatility of the S&P 500 and it is obtained from options with one month maturity. It was introduced in 1993, but the way in which it is computed changed during the years: until 2003 it was calculated by using at-the-money Black-Scholes implied volatility. Then, the CBOE updated the formula which is actually based on a non-parametric method: in other words, there are no distributional assumptions like the log-normality of the Black-Scholes model.
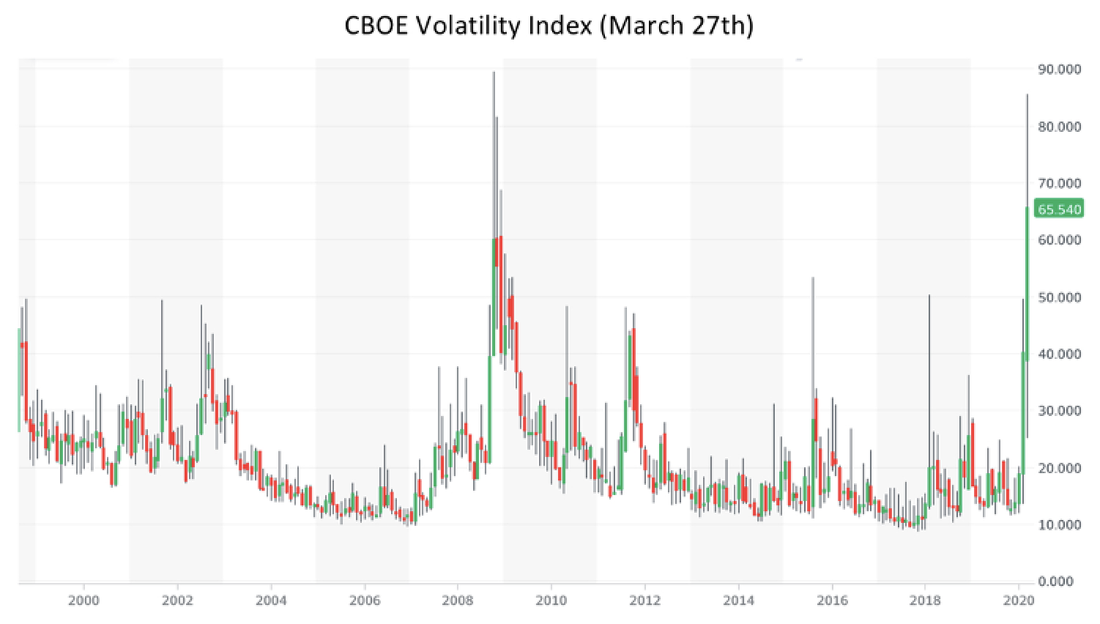
By looking at the history of this index, it shows two main spikes in 1987 and in 2008 associated with two periods of recession. Another period in which the VIX registered high values was between 1997 and 2000, years not characterised by a recession but associated with the dot-com bubble. Disregarding the periods mentioned above, the index has usually shown really long periods at low levels throughout its life. The VIX Index is considered to be mean reverting and its long term average is 21 points.
On March 16th the VIX index closed at 82.69, while during March 18th it touched the maximum of 85.47: these values are quite close to the maximum intraday peak of 89.53 happened in 2008, that actually still represent the highest value ever registered. Historically such values for the VIX index are associated with significant negative returns expectations. These values reflect the combined effects on the stock market of the coronavirus spread and the Oil price war between Saudi Arabia and Russia: in fact while the world fear for the contagious was increasing, OPEC and Russia announced an unexpected increase in oil production with the consequent price discount that could lead to investment cuts in the U.S. and many solvency problems for numerous firms in the industry.
Source: Yahoo Finance
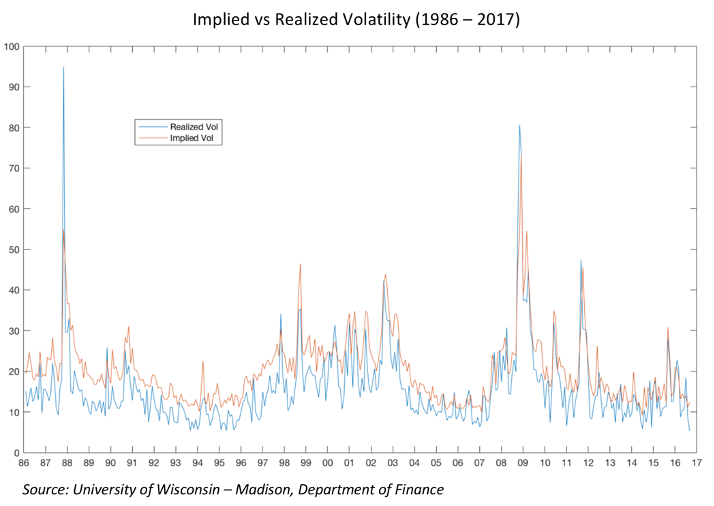
More informations on the market sentiment can be taken out from the VIX futures term structure. VIX futures are highly positively correlated with VIX itself and they have a negative market β. Normally the VIX futures term structure is upward sloping, meaning that volatility is expected to slightly increase in the future. The price of VIX futures depends on expectations on the future value of the VIX: since traders are not risk neutral, they will require a premium that makes the price of the future higher than the spot price. The following graph shows implied volatility and realized volatility during the years.
Source: University of Wisconsin
Historically the premium required by investors has been too high: the blue line (realized) is almost always under the red line (implied), meaning that expectations on volatility have been exceeding what really happened in the market. As a consequence and in light of the risk premium mentioned before, futures always trade above the forecast. Long positions on VIX futures, on average, have negative expected returns. Traders usually make money by shorting VIX futures, since the higher price of the future tends to the spot while approaching maturity.
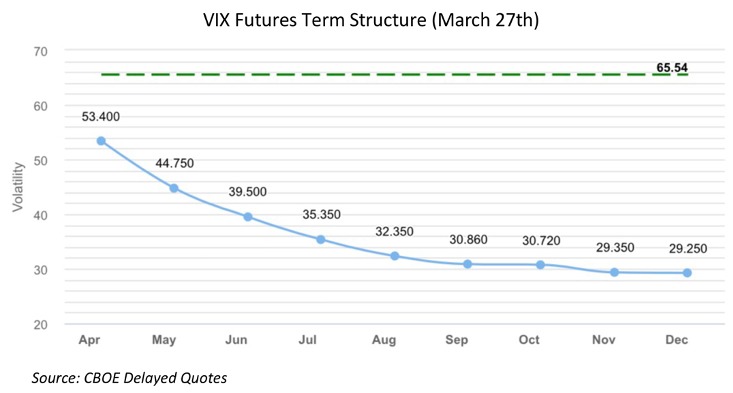
Nowadays, the VIX Index is high and conversely of what happens in normal times the VIX futures term structure is downward sloping: investors expect volatility to decrease in the next months. The contract with expiration in May 2020 trades at 44.75 which continues to represent a high value for VIX associated with high uncertainty.
This data may suggest that in this case a long position on this type of contract may be an opportunity, as many traders reduced their short positions on VIX futures and options. By the way, this kind of speculative behaviour is very risky, since VIX futures are hyper volatile and in the past many funds incurred in huge losses by betting on volatility.
Source: CBOE
Leonardo Baldassarri
Want to keep up with our most recent articles? Subscribe to our weekly newsletter here.
Leonardo Baldassarri
Want to keep up with our most recent articles? Subscribe to our weekly newsletter here.


