What is monetary policy?
Monetary policy represents a set of tools central banks have at their disposal to promote sustainable economic growth in their own countries through the direct control of the overall supply of money that is available to the nation's banks, its consumers, and its businesses. For instance, the central bank may be willing to discourage spending by forcing up interest rates on borrowing or inspire more borrowing and spending with lower rates. As a matter of fact, the central bank sets the rates it charges to loan money to the nation's banks and when it raises or lowers its rates, all financial institutions tweak the rates they charge all of their customers, from big businesses borrowing for major projects to home buyers applying for mortgages.
What is more, besides the interest rates, a central bank’s activities mainly include buy or sell government bonds, regulate foreign exchange (forex) rates, and revise the amount of cash that the banks are required to maintain as reserves.
In the US, the task to manage monetary policies is fulfilled by the Federal Reserve Bank (Fed), which has what is commonly known as a “dual mandate”: reduce unemployment to the minimum while keeping inflation under control.
Broadly speaking, monetary policies can be categorized as either expansionary or contractionary. On the one hand, expansionary policies are aimed at increasing economic growth and expanding economic activity: if a country is facing high unemployment due to a slowdown or a recession, a central bank might lower interest rates to both boost investments (i.e., businesses and individuals can get loans on more favorable terms) and increase customer spending (i.e., with lower rates, saving looks less attractive). On the other hand, a contractionary monetary policy might be necessary to slow down the growth of the money supply and bring down inflation (i.e., keep prices in check).
Which monetary policies did the Fed implement during the pandemic?
Introduction
The coronavirus crisis in the US – with more than 40.5 million cases and more than 652,000 deaths – triggered a deep economic downturn of uncertain duration, sending the US economy into a recession.
As a matter of fact, at the beginning of the pandemic, widespread uncertainty and forced lockdowns pushed the US stock market into bear market territory (i.e., price declines), with the S&P 500 not recovering to pre-pandemic highs until early summer 2020. Similarly, the US unemployment rate rose as high as 14.7% in April 2020 – the highest since the Great Depression. Still, it is slowly returning to its 4-5% natural rate (i.e., lowest rate whereby inflation is stable).
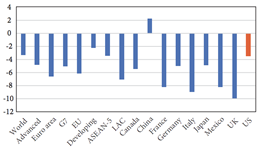
Measured by real (inflation-adjusted) gross domestic product (GDP), the national economy fell by 3.5% year-over-year (YOY) in 2020, from a growth rate of 2.2% in the previous year. Still, with respect to most other countries around the world, the decline in growth was relatively small.
Figure 1. 2020 Real GDP Growth Rate for Selected Countries and Groups of countries (%)
Source: IMF (2021)
Source: IMF (2021)
To complement the fiscal stimulus provided by the US government, the Fed took a series of substantial monetary stimulus measures: in several cases, the programs were revivals of those created during the financial crisis of 2007-2009. In particular, the measures implemented can be categorized into three basic categories: interest rate cuts, loans and asset purchases and regulation changes.
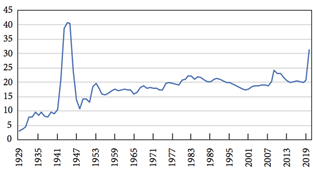
Figure 2. Federal Net Outlays, 1929-2020 (% of GDP)
Source: FRED, Federal Reserve Bank of St. Louis
Source: FRED, Federal Reserve Bank of St. Louis
1. Interest rates
- Federal funds rate: the Fed cut its benchmark interest rate, the federal funds rate (i.e., the rate at which commercial banks borrow or lend their excess reserves to each other overnight), twice during March 2020 – once by 0.50% and a second time by 1.00%. This lowered the federal funds rate, which is expressed as a range, from 1.50% to 1.75% to 0.00% to 0.25%. In particular, the federal funds rate is a benchmark for other short-term rates, and also affects longer-term rates, so this move is aimed at lowering the cost of borrowing on mortgages, auto loans, home equity loans, and other loans, but it will also reduce the interest income paid to savers. On March 15, 2020, the Fed also cut its discount rate, another key interest rate, by 1.5%, down to 0.25%.
- Forward guidance: offering forward guidance on the future path of its key interest rate (a tool used during the 2007-2009 financial crisis), the Fed has declared that rates will remain low until it was confident that the economy was on track to achieve its maximum-employment and price-stability goals (i.e., 2% inflation longer-run goal).
2. Loans and Assets Purchases
Supporting Financial Market Functioning
Supporting Financial Market Functioning
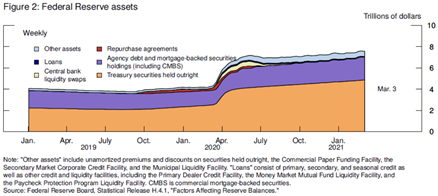
- Securities purchases: one of the simplest asset-purchasing programs implemented has been the Quantitative Easing (QE), through which the Fed directly buys assets like U.S. Treasuries and Mortgage-Backed Securities (MBSs). In particular, targeting specified amounts of assets to purchase, QE increases the money supply by purchasing assets with newly created bank reserves in order to provide banks with more liquidity. While at the beginning of March the Fed declared that it would buy around $500bn in Treasury securities and $200bn in government-guaranteed mortgage-backed securities over “the coming months”, later it made the purchases open-ended, saying it would buy securities “in the amounts needed to support smooth market functioning and effective transmission of monetary policy to broader financial conditions.” Between mid-March and early December of 2020, the Fed’s portfolio of securities held outright grew from $3.9 trillion to $6.6 trillion.
- Lending to securities firms: through the Primary Dealer Credit Facility (PDCF) the Fed offered low interest rate (currently 0.25%) loans up to 90 days to 24 large financial institutions known as primary dealers. Credit extended to primary dealers under this facility may be collateralized by a broad range of investment grade debt securities, including commercial paper and municipal bonds, and a broad range of equity securities. The interest rate charged will be the primary credit rate, or discount rate, at the Federal Reserve Bank of New York.
- Backstopping money market mutual funds: through the establishment of a Money Market Mutual Fund Liquidity Facility, or MMLF, the Fed lent to eligible financial institutions secured by high-quality assets purchased by the financial institution from money market mutual funds. Money market funds are common investment tools for families, businesses, and a range of companies. The MMLF will assist money market funds in meeting demands for redemptions by households and other investors, enhancing overall market functioning and credit provision to the broader economy.
- Repo operations: to ensure there was enough liquidity in the money markets, the Fed vastly expanded the scope of its repurchase agreement (repo) operations (i.e., where firms borrow and lend cash and securities short-term, usually overnight), through which the Fed’s facility makes cash available to the primary dealers (i.e., banks or other financial institutions) in exchange for government-backed or Treasury securities. With the pandemic, the Fed has greatly expanded the program, offering $1 trillion in daily overnight repo, $500 bn in one-month repo, and $500 bn in three-month repo.
Figure 3. Federal Reserve Assets
Source: Federal Reserve Board, Statistical Release H.4.1., “Factors Affecting Reserve Balances”.
Source: Federal Reserve Board, Statistical Release H.4.1., “Factors Affecting Reserve Balances”.
Supporting Corporations and Businesses
Supporting Households and Consumers
Supporting State and Municipal Borrowing
- Direct lending to major corporate employers: to support highly rated U.S. corporations, the Primary Market Corporate Credit Facility (PMCCF) allowed the Fed to lend directly to corporations by buying new bond issuances and providing loans. Borrowers could defer interest and principal payments for at least the first six months so that they had cash to pay employees and suppliers. But during this period, borrowers could not pay dividends or buy back stocks. Similarly, under the new Secondary Market Corporate Credit Facility (SMCCF), the Fed could purchase existing corporate bonds as well as bond exchange-traded funds (ETFs) on the secondary market. The combined purchase limit for the programs was $750 billion, up from an initial $200 billion. The Treasury Department contributed a total of $75 billion in initial capital to these two programs from the ESF: $50 billion for the PMCCF and $25 billion for the SMCCF.
- Commercial Paper Funding Facility (CPFF): a special-purpose vehicle (SPV, i.e., a subsidiary created by a parent company to isolate financial risk) to purchase commercial paper (i.e., unsecured, short-term debt instrument issued by corporations, typically used for the financing of short-term liabilities). Similar to the one created during the financial crisis to fight the credit crunch in 2008, the goal of the CPFF is to reduce the risk that eligible issuers will be unable to repay investors.
- Supporting loans to small- and mid-sized businesses: through the Main Street Lending Program, the Fed set up an SPV to purchase up to $600bn in small- and medium-sized five-year business loans. According to the plan’s terms, the Fed purchased a 95% stake of each loan, with the bank keeping 5%. In particular, the businesses selected needed to have either 10,000 or fewer employees or up to $2.5 billion in 2019 revenue. In July 2020, the Fed expanded the Main Street Lending Program to non-profits, hospitals, schools, and social service organizations that were in sound financial condition before the pandemic.
Supporting Households and Consumers
- The Fed on March 23, 2020 restarted the crisis-era Term Asset-Backed Securities Loan Facility (TALF): through this SPV, the Fed boosted consumer spending by issuing loans to banks using asset-backed securities (ABS) as collateral – with enhanced liquidity, banks can issue more credit to consumers and small businesses, increasing economic activity. In particular, the collateral for these securities was made up of auto loans, credit card loans, and other loans guaranteed by the SBA. In particular, this SPV initially made up to $100bn in loans on a non-recurse basis (i.e., in case the borrower defaults, the issuer cannot seek further compensation to the collateral), with a maturity of three years.
Supporting State and Municipal Borrowing
- Direct lending to state and municipal governments: through the Municipal Liquidity Facility, the Fed put up to $500bn to purchase debt from states and local governments that experienced revenue declines during the pandemic. In particular, the Fed purchased short-term municipal notes (i.e., debt issued to finance capital expenditures, such as infrastructures) from the states and the District of Columbia, certain cities and county governments, and multistate entities.
3. Regulation Changes and Policies Updates
Encouraging Banks to Lend
Encouraging Banks to Lend
- Direct lending to banks: to support the liquidity and the stability of the banking system, the Fed lowered the rate (i.e., federal discount rate) that it charges banks for loans from its discount window (i.e., lending facility to help banks manage short-term liquidity needs) by 2 percentage points, from 2.25% to 0.25%. These loans are typically overnight and the cash allows banks to keep functioning (i.e., money withdrawals and loans).
- Temporarily relaxing regulatory requirements: increase lending during the downturn, the Fed has encouraged banks to dip into their regulatory capital and liquidity buffers (i.e., additional loss-absorbing capital to prevent future bailouts). In addition, the Fed also eliminated banks’ reserve requirement (i.e., % of deposits that banks must hold as reserves to meet cash demand).
What is fiscal policy?
As a complement to monetary policies, fiscal policies have been a crucial instrument used by US government to limit pandemic impacts Fiscal policy is the use of government spending and taxation to influence the economy, and to promote stable and sustainable growth. During recent global economic crises, fiscal policy objectives gained prominence, as governments stepped in to help out financial systems, ramp up growth and mitigate the impact of the crises on vulnerable groups.
Fiscal policies can have contractionary or expansionary effects, depending on the aim. Contractionary fiscal policies occur when governments decrease their spending and/or increase taxes. On the other hand, expansionary policies occur when government spending increases and/or taxation decreases.
Which fiscal policies did the Government implement during the pandemic?
Between March and April 2020, Congress intervened with relief packages, which were then followed by proposals of the individual political parties. The first plans proposed by the Congress were:
The details of the plan were focused on:
As a complement to monetary policies, fiscal policies have been a crucial instrument used by US government to limit pandemic impacts Fiscal policy is the use of government spending and taxation to influence the economy, and to promote stable and sustainable growth. During recent global economic crises, fiscal policy objectives gained prominence, as governments stepped in to help out financial systems, ramp up growth and mitigate the impact of the crises on vulnerable groups.
Fiscal policies can have contractionary or expansionary effects, depending on the aim. Contractionary fiscal policies occur when governments decrease their spending and/or increase taxes. On the other hand, expansionary policies occur when government spending increases and/or taxation decreases.
Which fiscal policies did the Government implement during the pandemic?
Between March and April 2020, Congress intervened with relief packages, which were then followed by proposals of the individual political parties. The first plans proposed by the Congress were:
- The Coronavirus Preparedness and Response Supplemental Appropriations Act, that allocated $8.3 billion mainly for vaccine research
- The FFCRA Act (Families First Coronavirus Response Act), which consisted in $192 billion to support families and lower the cost of covid-19 testing
- The CARES Act (Coronavirus Aid, Relief and Economic Security), amounting to $2.3 trillion directed to unemployed workers, government loans to companies and small businesses, hospitals and schools. The CARES Act was later supplemented by an additional $484 billion, mainly to increment the loans for small businesses.
The details of the plan were focused on:
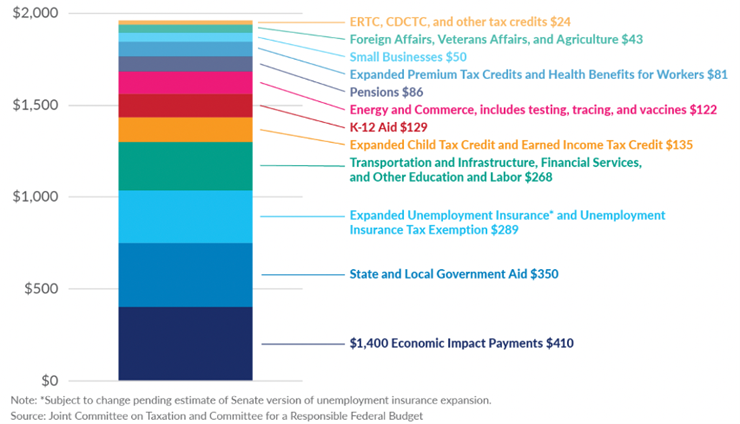
- The Direct Aid program, which accounted for $1tn of the total spending, and consisted of cash payments of $1,400, in addition to the previous stimulus of $600, to families earning less than $75,000 a year. Those checks were also combined with funding for childcare and homeless assistance, and emergency rent and mortgage payments support.
- Public Health and School reopening plans received $400 billion. In particular, the goal was to expand the Obamacare proposal by introducing premium-free insurance options, reaching a level of 97% of Americans insured.
- The remaining was dedicated to support local communities.
Figure 4
Source: Joint Committee on Taxation and Committee for a Responsible Federal Budget
Source: Joint Committee on Taxation and Committee for a Responsible Federal Budget
What is the effect on inflation?
The major concern of many economists and policymakers in the US and around the world right now is that the government’s expansive fiscal policy, along with the Fed’s loose monetary policy, will lead to an inflationary spiral. In particular, “demand-pull effect” refers to the idea that an increase in the money (and/or credit) supply stimulates overall demand for goods and services more rapidly than the economy's production capacity, bringing about an increase in prices.
Still, despite the present “transitory” high inflation (latest detections show a 5.4% inflation rate), which mainly affected vehicles, food and other shelter goods, the worries about a further (and more “persistent”) increase in inflation brought about by the fiscal stimulus seem to be unwarranted: first of all, analysing the situation from a pure macroeconomic perspective, the US economy was not close to full employment before the pandemic (i.e., if unemployment rises below its non accelerating inflation rate, NAIRU, inflation rate will increase along the Phillips curve). Second, the propagation mechanisms that could lead to accelerating inflation, “built-in” inflation (i.e., higher inflation rate forces workers to demand higher nominal wages in the next period and this eventually brings inflation even higher), are not in place anymore, as organized labor most likely does not have the power to translate increases in inflation into the increases in nominal wages that would probably lead to a further increase in inflation in the future. To conclude, it is possible that inflation will remain elevated in the next few months, but this is because of “base effects” as prices increase to their normal trajectory after the pandemic, or because of bottlenecks in the global value chains, known as “cost-push” effects (e.g., shortages of semiconductors and of energy), that are unrelated to the size of the fiscal stimulus in the US.
Debt Ceiling
Historical introduction
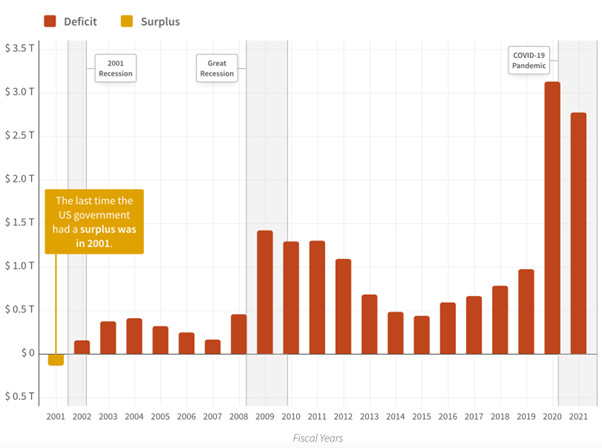
Historically, the budget deficit in the United States can be credited to three main fiscal forces, 1) The War on Terror following 9/11, 2) Tax Cuts, and 3) Healthcare Costs. Additionally, as of 2020, we must also consider a fourth factor 4) The Pandemic.
Historical introduction
Historically, the budget deficit in the United States can be credited to three main fiscal forces, 1) The War on Terror following 9/11, 2) Tax Cuts, and 3) Healthcare Costs. Additionally, as of 2020, we must also consider a fourth factor 4) The Pandemic.
Figure 5. Federal Deficit Trends over Time
Source: Data Lab
Source: Data Lab
The War on Terror
In 2001, when George W. Bush became the 43rd President of the United States, the country experienced its last budget surplus in history. In the same year, the 9/11 attacks and the 2001 economic recession occurred in rapid succession. Since then, each year, the United States has experienced an increasing budget deficit.
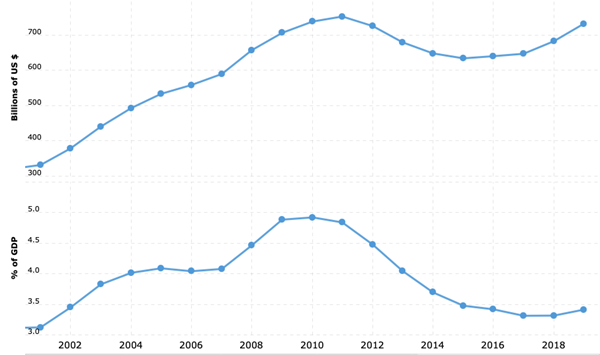
The 9/11 attacks dealt the country a massive blow, causing stock markets to immediately nosedive, and damaging almost every sector of the economy. Fortunately, the market and businesses bounced back in a relatively short time. Consequently, President Bush began his War on Terror, an international military campaign that aimed to eradicate the perpetrators of the 9/11 attacks. This doubled military spending, a trend that continued over the following years. Indeed, military spending accounted for over 10% of outlays in the 2020 fiscal year, at $778 billion. This was the highest military expenditure in the history of the United States. Despite America's decreasing involvement in military operations in recent years, the defense budget continues to make up a significant portion of the federal budget.
Figure 6. US Military Spending 2000-2021
Source: Macrotrends
Source: Macrotrends
Tax Cuts
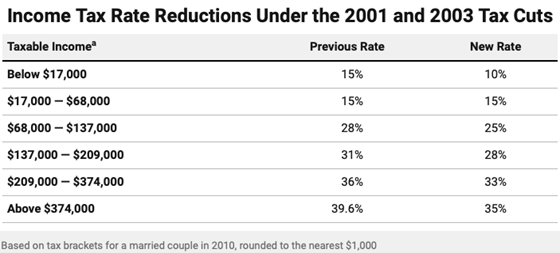
President Bush had another crucial impact on decades of budget deficits, through the implementation of one of the biggest tax policy changes in the United States, commonly referred to as the “Bush tax cuts”. Their main features included, the reduction of the top four marginal income tax rates, as well as the tax rate on capital gains and dividends.
President Bush had another crucial impact on decades of budget deficits, through the implementation of one of the biggest tax policy changes in the United States, commonly referred to as the “Bush tax cuts”. Their main features included, the reduction of the top four marginal income tax rates, as well as the tax rate on capital gains and dividends.
Figure 7
Source: Center on Budget and Policy Priorities
Source: Center on Budget and Policy Priorities
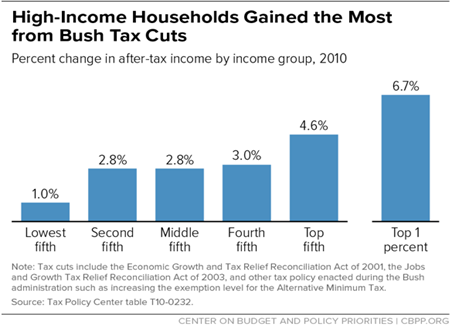
While the proponents claimed that these tax cuts would pay for themselves and stimulate economic growth, increasing tax revenue, they mostly benefited high-income taxpayers and economic expansion from 2001-2017 was reported as weaker than average. It is reported that, on average, high income taxpayer households received a total tax cut of $570,000 from 2004-2012. Additionally, they ballooned the deficit and contributed to income inequality. In 2013, the CBPP estimated that the tax cuts would contribute $5.6 trillion to deficits from 2001 to 2018.
Similarly, President Donald Trump imposed the Tax Cuts and Jobs Act in 2017, which cut the individual, corporate and estate tax rates. This is considered the biggest overhaul to the American tax code in 30 years. It is also predicted to add $2.289 trillion to the national debt, and $1,456 billion total to the annual deficits over ten years. The cost of the tax cut is enough to cause debt to exceed the size of the economy by 2028.
Similarly, President Donald Trump imposed the Tax Cuts and Jobs Act in 2017, which cut the individual, corporate and estate tax rates. This is considered the biggest overhaul to the American tax code in 30 years. It is also predicted to add $2.289 trillion to the national debt, and $1,456 billion total to the annual deficits over ten years. The cost of the tax cut is enough to cause debt to exceed the size of the economy by 2028.
Figure 8
Source: Tax Policy Center
Source: Tax Policy Center
Healthcare Costs
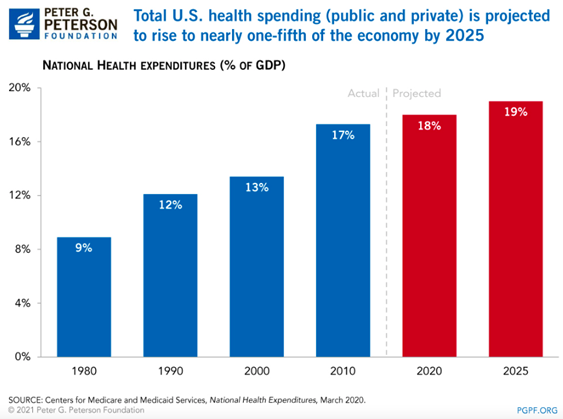
America’s inefficient healthcare system is one of the key drivers of its long term fiscal challenges. This presents a conundrum, as, despite paying more than other countries, Americans are not seeing better results. In fact, they are worse off in certain outcomes, such as life expectancy, infant mortality and asthma. Generally, the US spends $3,8 trillion, or 18% of the federal budget, on healthcare. This suggests a critical mismanagement of national healthcare spending. Indeed, experts are estimating that 30% of healthcare spending goes to unnecessary and wasteful services. Coupled with the ageing population and other demographic challenges, America's healthcare system leaves the country with an unsustainable fiscal future.
America’s inefficient healthcare system is one of the key drivers of its long term fiscal challenges. This presents a conundrum, as, despite paying more than other countries, Americans are not seeing better results. In fact, they are worse off in certain outcomes, such as life expectancy, infant mortality and asthma. Generally, the US spends $3,8 trillion, or 18% of the federal budget, on healthcare. This suggests a critical mismanagement of national healthcare spending. Indeed, experts are estimating that 30% of healthcare spending goes to unnecessary and wasteful services. Coupled with the ageing population and other demographic challenges, America's healthcare system leaves the country with an unsustainable fiscal future.
Figure 9
Source: organisation for Economic Co-operation and Development, OECD Health Statistics 2020, July 2020
Source: organisation for Economic Co-operation and Development, OECD Health Statistics 2020, July 2020
The Pandemic
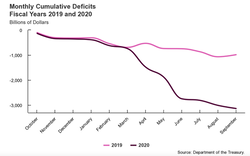
The US Federal Budget Deficit for 2021, was the second highest recorded in history. However, at $2.8 trillion, it was significantly lower compared to 2020’s, which was the highest in the country’s history. Totalling at $3.13 trillion, it was triple that of 2019.
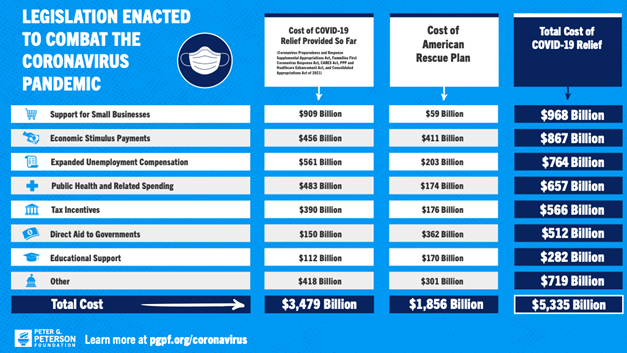
The federal government has enacted 6 pieces of legislation offering relief to individuals and businesses affected by COVID-19. To finance those provisions, which are estimated to cost $5.1 trillion, the Treasury Department has ramped up its borrowing. Indeed, since March 1st 2021, borrowing has increased by almost $5 trillion.
Click here to edit.
Figure 10
Source: Department of Treasury
Source: Department of Treasury
The two largest pieces of legislation were the American Rescue plan enacted on March 11 2021, which offered $1.9 trillion of federal relief, and The Coronavirus Aid, Relief and Economic Security act, which offered additional $2 trillion to combat the economic impact of the pandemic on corporations and individuals.
These included direct payments to individuals, extensions of unemployment benefits, tax incentives, health-specific measures, educational support, financial assistance to large companies and governments, economic support for small businesses, federal aid to hospital and healthcare providers, and many more.
These included direct payments to individuals, extensions of unemployment benefits, tax incentives, health-specific measures, educational support, financial assistance to large companies and governments, economic support for small businesses, federal aid to hospital and healthcare providers, and many more.
Figure 11
Source: Peter G. Peterson Foundation
Source: Peter G. Peterson Foundation
Current situation
The debt ceiling consists of the cumulative maximum amount of money that the Government is allowed to borrow through the issuance of bonds. It was introduced under the Second Liberty Bond Act of 1917, and since then it has improved the efficiency and fiscal responsibility of Government’s funding.
Throughout October 2021 the debt ceiling has hit a limit of $28.3 Trillion, with the Treasury Department that has implemented “extraordinary measures” to momentarily finance the government and grant lawmakers with additional time to act. Janet Yellen, secretary of the Treasury department, had identified the 21st of October as the crucial deadline for funds exhaustion.
After rejecting Democrats’ plans, the minority leader Mitch McConnell, offered his support for a stopgap measure by agreeing to raise the ceiling by $490bn on the 7th of October; enough to sustain government spending until early December. The reason why Republicans are reluctant to raise the debt ceiling for the long-term is that it would facilitate the implementation of Biden’s $3.5 Trillion Build Back Better plan, which was considered too expensive for an economy that is still recovering from the pandemic.
In fact, since its creation, the debt ceiling has always been a political weapon for Republicans and Democrats, and the recent problems have brought some questions about the effectiveness of this debt management policy. The debt ceiling has certainly made the issuance of debt more practical, allowing the U.S. Treasury to issue debt, whenever the Government was in need, without requiring the approval of the Congress. However, despite being raised 78 times since World War I, it might represent a risk of default for the country.
To avoid undermining the investors’ faith in the American markets, lawmakers have proposed some alternatives to the current borrowing limit, but it is unclear whether they will be able to sustain them anytime soon. Janet Yellen suggested the possibility of entrusting the Treasury department with the power to lift the debt cap, while McConnell had already advanced the idea of giving this responsibility to the president in 2011. Both measures would remove the eventual bipartisan clashes from the equation and possibly increase the stability of such decisions.
We must keep in mind that the menace of a possible default would cause a dramatic scenario, consisting of an economic catastrophe that would halt the government’s spending programs and destroy the dollar’s strength, causing financial markets to plummet, and terribly affecting the global economy, as the dollar represents the world’s reserve currency.
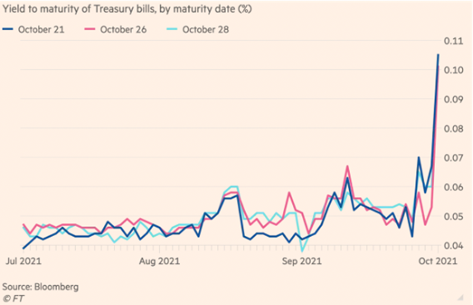
Following the news of early October, the $22tn Treasury market was affected as investors got rid of the short-term bills maturing around the 21st of October, causing the yield to rose from 0.07 to 0.14 on the 1stof October. After the strengthening of the debt ceiling deal on the 7th, the S&P 500 index increased by 0.8%, starting a rally that registered new all-time highs on October 20.
Figure 12. Yield to maturity of Treasury bills, by maturity date
Source: Financial times
Source: Financial times
Sources
by Alessandro Maraldi, Tommaso Tienti, Natalia Szperna
- Investopedia
- NYTimes
- DataLab
- CBO
- CRBF
- Macrotrends
- PGPF
- IMF
by Alessandro Maraldi, Tommaso Tienti, Natalia Szperna
