Introduction
Over the past five decades, we have experienced the rapid growth of the technology sector and all of its consequences. Since the dotcom bubble, tech-based firms have often earned above average valuations in the markets for their growth potential, but this has raised concern among both large-scale and retail investors alike. In this article, we will analyse technology IPOs market trends, some recent successful cases and present some arguments as to whether or not these tech firms are worth the hype.
Overview of the US Tech IPOs Market in the last two years
2020 Trends
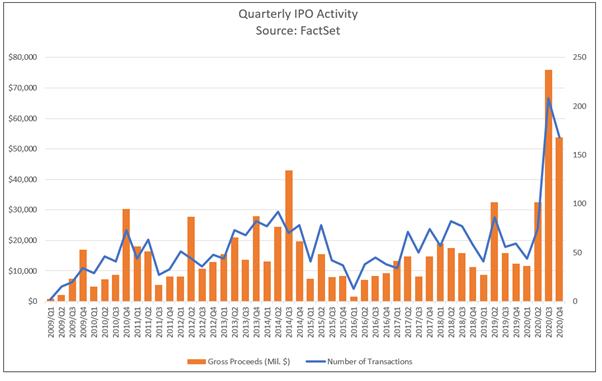
2020 started a new era for freshly listed US companies. Valuations hit a two decade high last year, with listings and revenue multiples continuing to climb this year. In a year during which the pandemic upended financial markets and economies worldwide, US companies and their largest shareholders raised a record amount with stock sales.
However, during the first quarter, the US IPO market was rattled. As 2020 began, all signs pointed to a continuation of 2019’s solid IPO activity. Then, a string of market losses in response to the growing COVID-19 pandemic caused the market to dry up, with just two companies going public between February 24 and March 31. The Q1 2020 IPO activity was the weakest we have seen in three years, with just 35 IPOs. The depressed activity was a direct consequence of the US government shutdown.
The second quarter was also characterized by hesitation around new offers. In total there were 32 new IPOs between March and May, the lowest three-month in three years. However, we saw a turnaround in IPO activity in June as equity markets rebounded. The renewed optimism saw a flood of companies going public in June, with 41 companies IPOing. The gross proceeds from the quarter totaled $25 billion.
In the third quarter, US IPO activity surged as a result of market recovery, past the point of anything we have seen since the Global Financial Crisis. 208 companies went public through an IPO on the US exchanges, each month exceeding standards. This was mainly driven by the Special Purpose Acquisition Companies (SPACs) boom. In Q3, 77 SPACs went public representing 47% of all IPOs and total gross proceeds ($61 billion). This was double the money raised in Q2 and the largest quarterly amount raised in the last decade.
Finally, the breakneck pace of activity calmed in the fourth quarter, with 168 IPOs recorded and gross proceeds of $53.8 billion. In all 2020, there were a total of 555 IPOs recorded, which raised $174 billion, a 150% increase over 2019. The Finance sector was the leader in 2020 IPOs both in terms of value and money raised. Health technologies and the technology services sectors were in second and third place respectively, with health technologies taking the lead in the first half of 2020 due to the impact of the pandemic.
Source: Factset
2021 Trends
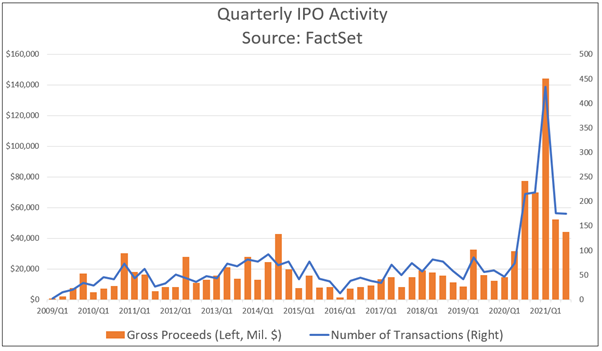
The first quarter of 2021 saw the biggest surge of IPO activity yet. The trend of the SPAC boom continued into Q1 2021, representing 70.7% of all IPOs. In aggregate, IPOs raised $128.9 billion in Q1 with 365 IPOs, an 84.3% jump compared to the previous quarter. The rush in IPO activity led to a proportionate increase in mega-IPOs, while the dominance of SPACs led to a surge in IPOs raising $100-500 million.
In the second quarter, the number of IPOs dropped as the surge of SPACs calmed. There were just 39 SPAC IPOs of the total 176 IPOs recorded in Q2. In aggregate, IPOs raised $50.9 billion, down 63.7% compared to Q1. Finally, US equity markets remained essentially flat in the third quarter of this year: 175 IPOs took place, almost identical to the numbers from the previous quarter. Gross proceeds equaled $44 billion, down 15.1% from the previous quarter, and there were 60 SPAC IPOs, up from 46 in Q2.
Year to date, 2021 has already set new records. From Q1 to Q3, 785 companies have IPO’d on US exchanges this year, ahead of the 555 offering for the full year of 2020. This year to date volume is the highest recorded in history.
The finance sector continued to consistently lead in IPO volume, with Technology services and Health technologies in second and third place respectively, in 2021.
Source: Factset
Tech Unicorns today vs the “dot-com bubble”
Profitable tech start-ups are becoming rare, with most remaining loss-making. Loss-making tech firms are making up a greater share of high valued IPOs these days, with the industry prioritizing growth over profits. Investors are willing to tolerate these losses with hopes of high returns in the future.
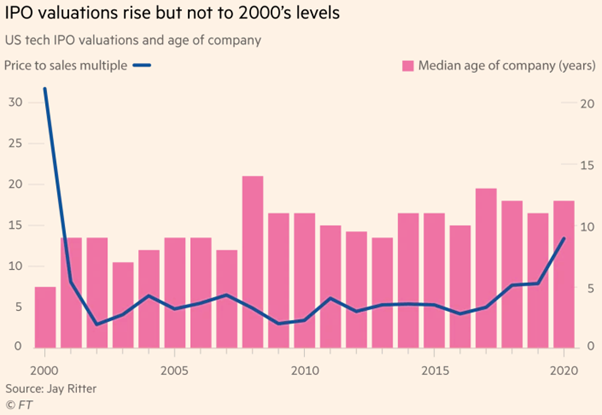
In the first six month of 2021, 58 unicorns, VC-backed startups valued at $1 billion or more, went public and raised $56.3 billion. This size of fund raising is unprecedented, almost four times the average of 2016. This was initiated by the boom in IPO activity and valuations observed in the third quarter of 2020, prompted by the newest round of pandemic recovery. The average tech company going public in 2020 received a higher multiple of trailing revenue than in the past decade. Indeed, the median price-to-sales ratio was 13.4 times, which is about 19% higher than in 2019. For example, the trading app Robinhood, infamous for its lack of trading commissions and meme stocks, listed at a $32 billion valuation, about 32 times trailing year sales. This has prompted doom laden comparisons to the dot-com bubble of 2000.
Source: Financial Times
However, underlying the sky-high valuations, there are business models that are low cost and scalable, adding up to lower risk. On the other hand, during the dot-com boom, internet companies went public with little revenue with business models requiring huge sums of data centers and sales and marketing. Thus, some remain optimistic believing that in the current situation, unicorns are built to last.
Conversely, the rise of meme stocks, the surge in IPOs and SPACs especially, could be another case of over-optimism and speculation spinning out of control. Investors are buying companies with weak foundations, facing significant challenges. The IPO and SPAC bubble as well as pricey valuations, are eliciting concerns similar to those of the 2000 bubble. If the highly valued momentum stocks start to pull back, the damage could be severe.
A closer look at major tech IPOs
As we previously mentioned, the tech momentum coupled with SPAC activity that influenced 2021 and pushed the IPO market above predicted levels are two major trends worth analyzing more deeply. In fact, the best performing IPO of 2021 was Digital World Acquisition, a blank-check company with a market capitalization of $1.9 billion, that has made over 500% gains since its IPO in March 2021. CEO Patrick Orlando of Benessere Investment Group, is currently looking for emerging tech-focused companies in SaaS or in the fintech sector.
On the other hand, tech support companies such as TaskUs, whose mission is to provide customer support services to tech giants such as Uber and Netflix, also concluded a successful IPO with market capitalization of $4.3 billion. The Blackstone-backed firm took advantage of the growth that the tech industry experienced during the pandemic and began working with Coinbase, Uber and Zoom, thus raising their revenues by 33%, to $478 million. This trend within the technology industry even expands to coding, as the code-sharing GitLab platform raised $650 million in October, following a revenue increase of 69% in Q2 of 2021.
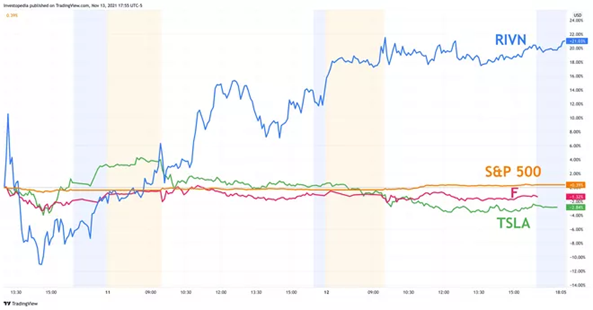
And at the peak of the tech frenzy lies Rivian, the electric vehicle maker that shocked the world with its record-breaking IPO, raising $12 billion with just under $1 million of recorded revenue. After being founded in the silicon valley by tech entrepreneur Robert "RJ" Scaringe, Rivian experienced a turbulent start as its first sports vehicle was shelved without any proponent buyers. It only began designing its current models in 2015, but deliveries were delayed until October 2021, only a month prior to its IPO. Today, there are less than 100,000 Rivian vehicles, but the company has exceeded both General Motors and Ford in terms of market capitalization. Its major competitor Tesla also experienced a similar growth pattern when developing its first fast-charger, which shows the importance of the electric vehicle market within tech-based financing.
Source: TradingView
Another tech trend that shifted the IPOs market in 2021 was the surge in neobanks, also known as “challenger banks”. These innovative financial institutions operate entirely online, and have emerged as a solution to overcomplicated fee structures and underbanked customers in isolated markets. Berkshire-backed Nubank raised $2.6 billion in their recent IPO, with a valuation of $41.4 billion and over 50 million customers gathered in just under 8 years. Its impressive growth showcased the acceleration of the fintech space, especially during the Covid pandemic. Chime, a San Francisco-based neobank, is also planning an IPO in March 2022, with an expected valuation of over $35 billion. Just within the US, fintechs have raised approximately $43 billion in funding in 2021, more than double last year’s total. In Europe, this trend also continues with UK-based Revolut and Zupa and Swedish Klarna in the lead.
Why are valuations so high?
Approximately 90% of start-ups fail within a year in Silicon Valley. Despite these odds, global VC funding reached a record of $300 billion in 2020, and this private-side momentum often feeds straight into public markets.
So why exactly do tech IPOs possess such extreme valuations?
According to the WSJ, tech valuations are more “art than science.” They are, according to professors at UBC and Stanford, approximately 48% overvalued in relation to their intrinsic value. This can be attributed to private funding rounds and protection provisions such as liquidation preferences designed by VC funds to protect their investments early on, in case the startup experiences bankruptcy. Private valuations, therefore, are inherently overvalued, producing a “hype” phenomenon we witness recurrently prior to most tech IPOs.
Are tech IPOs worth the hype?
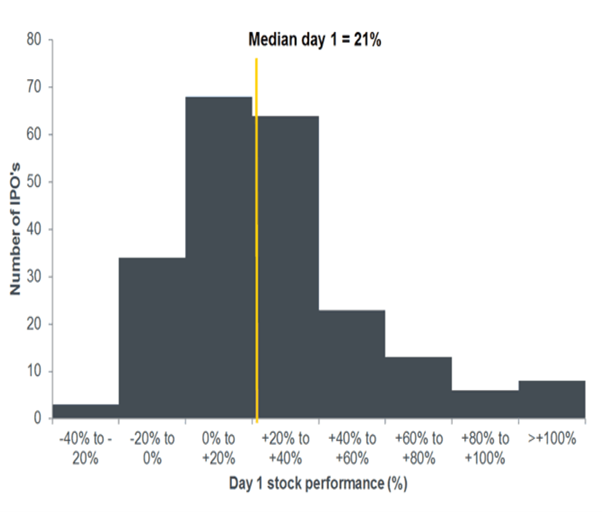
A question that naturally comes to mind when talking about tech IPOs is whether they are actually worth the hype. Everyone likes to talk about tech start-ups and companies, they tend to be making the news pretty easily and in many cases stock prices skyrocket short after the release on the market. As Janus Henderson highlighted after having conducted an in-depth analysis covering 220 tech companies, historically tech deals have done very well upon release. On average, on day 1 stock prices have risen about 80% of the times, with an average increase of 21%.
Source: Bloomberg, Janus Henderson
However, things change when looking at the broader picture, that is analyzing the first year post IPO. Findings reveal that average first year returns tend to range around -19%, representing a decline after the initial enthusiasm. Technically, declines are also seen 5 to 6 months after the IPO, and this can be explained by the fact that the lock-up expiration date is set 180 days post-IPO. Effectively, VC investors must wait for the lock-up period to end before being able to sell their shares in the market, resulting in big share sales that eventually decrease the price.
Share performance post-IPO sparks light on yet another point: tech returns have a variability that’s roughly three times greater than the broader market, making it fairly hard to analyze profitability of the sector as a whole.
So, considering tech IPOs in 2021, were they really worth the hype? Are they in bearish or bullish territory?
In the past year more than 50 US companies went public, whether that was through SPAC, direct listing or an IPO, and among them only one company - GlobalFoundries, operating in the semiconductor business - is less than 20% below its high stock price, according to CNBC’s Ari Levy. Furthermore, taking on Robinhood’s high profile case, the company’s IPO was long discussed and all over the news when it took place earlier this year, on July 29. It was initially priced at 38$ a share, at the low end of expectations, but it skyrocketed at 70$ a share less than a week after only to start a slow decline resulting in the stock being worth 18$ as of December, 21st.
Moving forward, it is important to take into consideration also the geographical context when analyzing tech IPOs performance. While Silicon Valley might be the most-renowned location for tech companies, a study carried out by Cambridge Associates actually showed that the European market seems to be more mature, more profitable and more prolific. In 2021 alone European startups have managed to be on track to exceed $100bn in total VC investments and the European market produced 98 unicorns in 2021 according to Atomico. Europe’s supremacy also comes at the expense of the US market. Effectively, European startups have captured 13% more money available for funding rounds over the past five years, while US startups saw a 20% decline.
Finally, not all tech IPOs show a declining history. Among the most famous IPO deals, 2020 saw Californian cloud computing company Snowflake go public at a starting price of $120 a share with current stock price ranging around $331. Same goes for the famous homestay company Airbnb, after debuting on the market in early december 2020 at $68, it currently trades at around $157.
Conclusion
The tech sector has been rapidly growing for the past two decades. Although the pandemic caused an initial setback worldwide in IPO activity, the tech sector managed to rally and adapt, rebounding soon afterwards driven by momentum, SPACs and overall hype in the market. This can be seen through sky-high valuations of Rivian, Digital World Acquisitions and neobanks such as Nubank. And while some seem concerned by the similarities of the current market to the dot-com bubble, others seem confident that current tech is built to last. However, one cannot ignore that while tech deals tend to do very well upon release date, returns tend to be negative in the first year post release. It is thus important to consider all perspectives and not fall prey to a momentum spiral, nor get unduly discouraged.
Sources:
By Natalia Szperna, Ana Leticia De Souza Raposo, Chiara Benedetta Allievi
Share performance post-IPO sparks light on yet another point: tech returns have a variability that’s roughly three times greater than the broader market, making it fairly hard to analyze profitability of the sector as a whole.
So, considering tech IPOs in 2021, were they really worth the hype? Are they in bearish or bullish territory?
In the past year more than 50 US companies went public, whether that was through SPAC, direct listing or an IPO, and among them only one company - GlobalFoundries, operating in the semiconductor business - is less than 20% below its high stock price, according to CNBC’s Ari Levy. Furthermore, taking on Robinhood’s high profile case, the company’s IPO was long discussed and all over the news when it took place earlier this year, on July 29. It was initially priced at 38$ a share, at the low end of expectations, but it skyrocketed at 70$ a share less than a week after only to start a slow decline resulting in the stock being worth 18$ as of December, 21st.
Moving forward, it is important to take into consideration also the geographical context when analyzing tech IPOs performance. While Silicon Valley might be the most-renowned location for tech companies, a study carried out by Cambridge Associates actually showed that the European market seems to be more mature, more profitable and more prolific. In 2021 alone European startups have managed to be on track to exceed $100bn in total VC investments and the European market produced 98 unicorns in 2021 according to Atomico. Europe’s supremacy also comes at the expense of the US market. Effectively, European startups have captured 13% more money available for funding rounds over the past five years, while US startups saw a 20% decline.
Finally, not all tech IPOs show a declining history. Among the most famous IPO deals, 2020 saw Californian cloud computing company Snowflake go public at a starting price of $120 a share with current stock price ranging around $331. Same goes for the famous homestay company Airbnb, after debuting on the market in early december 2020 at $68, it currently trades at around $157.
Conclusion
The tech sector has been rapidly growing for the past two decades. Although the pandemic caused an initial setback worldwide in IPO activity, the tech sector managed to rally and adapt, rebounding soon afterwards driven by momentum, SPACs and overall hype in the market. This can be seen through sky-high valuations of Rivian, Digital World Acquisitions and neobanks such as Nubank. And while some seem concerned by the similarities of the current market to the dot-com bubble, others seem confident that current tech is built to last. However, one cannot ignore that while tech deals tend to do very well upon release date, returns tend to be negative in the first year post release. It is thus important to consider all perspectives and not fall prey to a momentum spiral, nor get unduly discouraged.
Sources:
- CNBC
- CNN
- Factset
- Financial Times
- Forbes
- Fortune
- Investor's Business Daily
- Janus Henderson Investors
- PitchBook
- PwC
- The Stack
- Wall Street Journal
By Natalia Szperna, Ana Leticia De Souza Raposo, Chiara Benedetta Allievi
