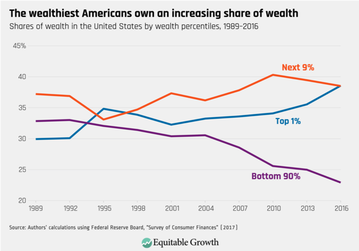
American households held an average of over $98trilliion of wealth in the last years. Wealth, or net worth, is defined as total assets minus total liabilities. This wealth, however, isn’t equally distributed, meaning that the impressive amount of average $692.100 net worth per person is, in fact, skewed by the so-called “super-wealthy” components, which also explains the remarkable difference over the median wealth ($97.000). In 2016 the top 1% of the population held more than the whole middle class: they owned over $25 trillion, while the middle class owned just $18 trillion. In 2017 they were holding the 38.6% of the overall net worth.
Fed reports show an increasing gap in wealth inequalities in USA. One-quarter of American workers make less than $10 per hour, setting themselves below the poverty level for a family of four. Moreover, the poorest 50% of Americans are literally getting crushed by the weight of rising inequalities as they barely own a share of US aggregate wealth against the top 10% of the distribution holding a large and growing share. What about this growth? According to a study by economists Emmanuel Saez and Thomas Piketty the top 1% averaged over 40 times more income than the bottom 90%. They are nowadays on their way to own two-thirds of all wealth by 2030.
Fed reports show an increasing gap in wealth inequalities in USA. One-quarter of American workers make less than $10 per hour, setting themselves below the poverty level for a family of four. Moreover, the poorest 50% of Americans are literally getting crushed by the weight of rising inequalities as they barely own a share of US aggregate wealth against the top 10% of the distribution holding a large and growing share. What about this growth? According to a study by economists Emmanuel Saez and Thomas Piketty the top 1% averaged over 40 times more income than the bottom 90%. They are nowadays on their way to own two-thirds of all wealth by 2030.
Source: Equitable growth
Income inequality in the US has hit its highest level since the Census Bureau started tracking it five decades ago, according to a report of last October, and the highest of all the G7 nations too, according to data from the Organization for Economic Cooperation and Development. The gap is remarkable both in wealthy regions among both coasts such as NY and California as in poorer areas such as Louisiana.
There is a very useful index to measure wealth distribution across a population: it’s called the Gini index, whose “zero” means total equality while “one” total inequality: during the last 50 years it rocketed form 0.397 until 0.485. Just to have a comparison term, no European nation had a greater score than 0.38 last year.
The topic has also become present in the debates for the 2020 presidential race, with candidates warning about the implications for living standards of US citizens: Bernie Sanders promised a tax on the ultrawealthy affirming that “There should be no billionaires”. Taxes on wealth are, indeed, a natural policy instrument to address wealth inequality and could raise valuable revenues giving force to the weak current income system.
However, this unfair distribution didn't use to be the case: before 1995, middle class’ shares were above the 1% of the wealthy ones. Since that moment, these ones have experimented a robust growth from the Great Recession, like the top 20% of the income groups. Meanwhile the middle class was driven by a tepid recovery due to a decline in home-ownership and stock market participation (since 2007): as they didn’t hold assets, they couldn’t benefit from recovery in asset prices.
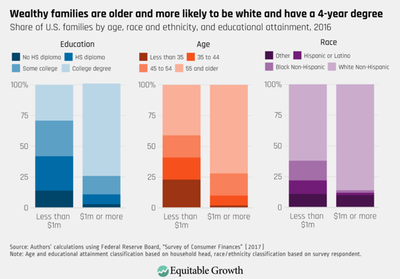
Another important issue about wealth distribution is about its accumulation by age: the median net worth of families led by a 65-aged or older increased by 68% in contrast with the one of families led by a 35-aged or younger that decreased by 25% (referring to the range period between 1989 and 2016). This fashion may be explained by two reasons: the increased value of education loans and the government benefits (projects of Social Security and health care) applied mainly on older families. The first issue is the most complex one: on the one hand the educational debt is a huge burden of younger shoulders. On the other hand, people with a 4-year college background will have in their career a bigger opportunity of holding more wealth. In addition, there is the problem related with net interest payments, by which younger families are expected to pay for debt-financed federal spending that benefited prior generations.
Apart from that, as shown in the graph, another discriminant variable in distribution of net worth seems to be the ethnic origin. Taking the results of a survey that took place in 2016 it appears that: white families had a median wealth of $171.000, black/African/American families $17.000 and Hispanic or Latino families $21.000. This demographic lens is an unusual point of view on the analysis of US wealth, even more reliable than the income bands, according to the St. Louis Fed’s Center for Household Financial Stability, because they may change from year to year when the economic mobility allows that.
Source: Equitable growth
All in all, inequality is structural when policies keep some groups from obtaining the resources to enhance their lives and it may occur even in a free market economy because of the laws that form it creating advantage for some and disadvantage for others. This system of privilege includes powerful socializing agents such as business practices, healthcare, education and media, that tell us what we can achieve within the society. Structural inequality prevents the disadvantaged ones from realizing their American Dream.
Maria D’Amato
Maria D’Amato

