In conformity with expectations, at its last meeting on March 16, the Federal Open Market Committee raised the target range for the federal funds rate for the first time since the start of the pandemic by 25 basis points to 25-50 bp. The reasons behind this action lie on two key points: a strong labor market characterized by increasing job gains, a falling unemployment rate, and elevated inflation.
Strong labor market: improved and increasing job gains and falling unemployment rate
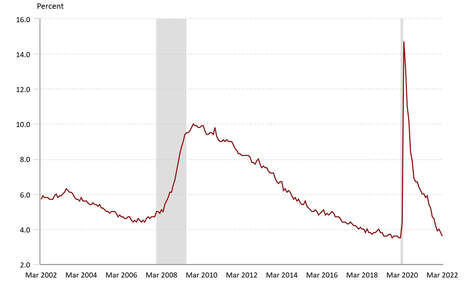
The labor market has “substantial momentum”, as J.Powell said, and indeed it has been continuing to strengthen since the start of the year and is now extremely tight. Over the first two months of the year, employment rose by over one million jobs. In February, the unemployment rate hit a post-pandemic low of 3.8 percent, much faster than anticipated by most forecasters. In March payroll report we have seen further 430’000 jobs added, and a decrease of 0.2% of unemployment rate.
The main sources of this labor market tightness are:
- The sheer volume of hiring and the strong financial position of households, that may have allowed people to be more selective in their job search (over time, we expect these factors to fade, reducing pressure in the job market).
|
Due to this imbalance between a very strong labor demand and a subdued labor supply, workers’ bargaining power has remarkably increased and improvements in labor market conditions have been widespread. As Daniel Zhao, senior economist at jobs site Glassdoor, said, “The fact of the matter is that workers who are upset about inflation have more leverage now in order to actually negotiate higher pay”.
As a result, there are a record average 1.7 job openings posted for each person who is looking for work, many are quitting their jobs to take up other ones with higher pay, and nominal wages are rising at the fastest pace in decades, especially for workers at the lower end of the wage distribution. |
“Elevated” inflation
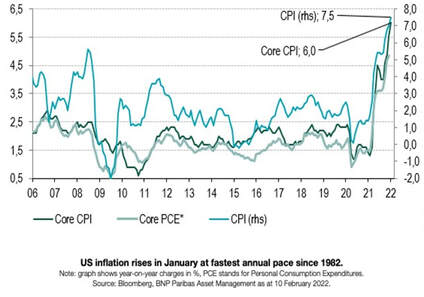
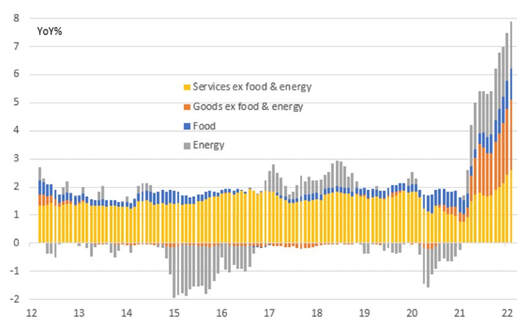
The rise in inflation was expected to reach a peak of 7% at the end of 2021, to then fall steadily, but it has been much greater and more persistent than forecasters generally expected.
The rise in inflation was expected to reach a peak of 7% at the end of 2021, to then fall steadily, but it has been much greater and more persistent than forecasters generally expected.
The pandemic, and the associated shutdown and reopening of the economy caused a serious turmoil in many parts of the economy, hindering supply chains, constraining labor supply, and creating a major boom in demand for goods, especially the durable ones. The combination of the surge in goods demand with supply chain bottlenecks led to sharply rising goods prices.
Moreover, upward pressure on inflation has been created by higher energy and other commodities’ prices resulting from Russia’s invasion of Ukraine, which helped drive gasoline to all-time highs and added uncertainty to an already insecure climate of financial angst.
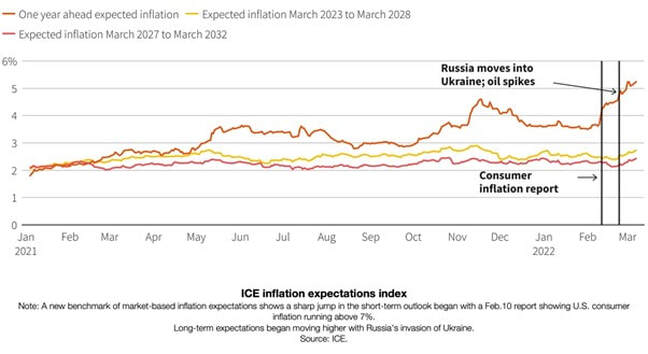
In the recent period, short-term inflation expectations have, obviously, risen with inflation, but what is worrying the Fed most is the possibility that longer-run expectations, pushed by an extended period of high inflation, may also rise. The unanchoring of lunger-run expectations would indicate a loss of confidence in the Fed's ability to control inflation, making it harder to beat, with a risk to incur in a wage-price spiral.
Recent policy decisions
Despite the imminent increase of 25 basis points, the FOMC also declared that ongoing rate increases will be appropriate to reach the Committee's goals (i.e., maximum employment and inflation at 2% over the longer run) and that it will begin reducing the size of Federal Reserve’s balance sheet beginning May. As Jerome H. Powell confirmed on March 21, these actions are necessary to “restore price stability while preserving a strong labor market”. The Fed Chair then added that it will be the case to move the stance of monetary level, not only to natural level, but also to more restrictive ones, facing a risk of recession, if that is what is required to restore price stability.
FOMC hopes that these less accommodative monetary policies will help bring inflation down to near 2% over the next 3 years, reminding that “each Summary of Economic Projections reflects a point in time and can become outdated quickly at times like these”, which suggests that further policy decisions will be probably needed in the short period.
What’s next? The risk of recession and the inverted yield curve
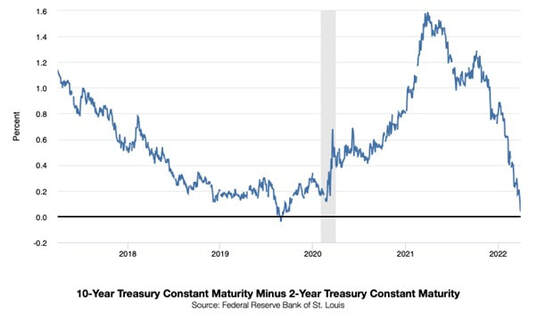
On Tuesday March 29, as investors priced in the aggressive rate-hiking plan by the Federal Reserve, the U.S. Treasury yield curve inverted for the first time since 2019, before the recession caused by the global pandemic. The yield curve reflects investors’ expectations of economic growth in the current period compared with economic growth in the future. According to this interpretation, a yield curve inversion implies that investors expect current economic growth to exceed future economic growth, indicating a period of stock market devaluation and shrinkage of banks’ profit margins (which makes the cost of borrowing rise).
The US curve has inverted before each recession since 1955, with a recession following between six and 24 months, and offered a false signal just once in that time, according to a 2018 report by the Federal Reserve Bank of San Francisco.
Indeed, the odds that a recession will follow next year are between 20% and 30% now, as Goldman Sachs’ analysts wrote in a note written to clients in which they advise that higher oil and food prices will shrink America’s GDP and lower the probability of an economic expansion.
Anyway, not everyone is convinced about the reliability of the spread index this time. Many are convinced that Fed's quantitative easing of the last two years has resulted in an undervalued U.S. 10-year yield that will rise when the central bank starts shrinking its balance sheet, steepening the curve. Additionally, on March 25 J. Powell confirmed that the economy is very strong and is well positioned to handle tighter monetary policy, and that the likelihood that the US will incur in a recession is “probably spurious”.
Inflation due to Covid and War
In recent times, how many people decide to go to work by bike or foot because the fuel cost has become unsustainable or go shopping in a discount store sacrificing food quality to save money? Undoubtedly this is due to the price increase during these months and to the inflationary thrust we are facing: consumer prices in the US in February have increased by 0,8% since January and by 7,9% since last year; US Inflation has thus touched the highest value in the last 40 years.
Due to the invasion of Ukraine and the consequent steep increase in gas prices and further disruption in global supply chains, US households are facing an abrupt rise in inflation. These events exacerbate the already high COVID-linked inflation: US current bout of inflation has come from the three factors that we’ve seen historically: war, oil-supply disruption, and a pandemic. It started when COVID depleted the global workforce, decimated supplies, and impaired supply chains. It has now been worsened by the war between Russia and Ukraine (supplier of 26% of the world’s wheat), and boycotts on the oil imports from Russia, estimated at five millions of barrels a day.
Inflation is also caused by a strong demand and supply constraints: the details show broad-based price pressures with housing shelter costs up 0.5%MoM, recreation and clothing both up 0.7% MoM with “other goods & services” up 1.1% MoM. Once again education (0.0%MoM) and medical care (0.2%) were on the softer end of the range, but this month they were joined by new vehicle prices (+0.3%) and used vehicles (-0.2%). These transport components have been a key factor pushing annual inflation higher since the pandemic struck and the annual rates of 12.4% and 41.2% are still huge, but it could hint that some improvements in supply chains are starting to take the heat out of the market.
While supply chain strains and labor shortages are a key story behind inflation, we also have to remember that strong stimulus supported demand is also a reason. As the chart below shows, goods price inflation is incredibly strong and the fact retail sales are currently 24% higher than they were in February 2020 underscores that point.
In the near term, inflation will head even higher. The surge in gasoline prices to $4.25/gallon from the February average of $3.50 will be enough to push headline inflation above 8.5% in March. Additionally, the rising cost of labor and agricultural and metal commodities will inevitably translate into higher input costs for businesses.
To sum up, US consumer prices have surged more than in other developed economies and one reason may be the massive government support provided to Americans during the pandemic.
The COVID-19 pandemic, apart from being a human tragedy, has also been a large-scale economic shock, during which the virus spread and social distance measures were adopted to contain it, and caused strong fluctuations in the economy, so should not be surprising that the pandemic period was marked by a considerable volatility of inflation. During 2020 the inflation rate has significantly decreased, touching below zero in the last months of the year, and reported a reversal in the course of the first months in 2021. Beside the variability of the short term, it was expected that in 2020-2021 (years marked by the pandemic) inflation rate was on average equal to 1.0%, a level close to the 2019 one. In March 2020, the consumer price index (CPI) has remained unchanged, and it decreased by 0.4% in April and by 0.1% in May, experiencing the only monthly consecutive downturns in the last forty years. During June the CPI remained stable, increasing by 0.5% in July and 0.3% in August. The inflation volatility of the period 2020-2021 is due to a series of transitional factors. First, the pandemic was related to a significant trend of fuel prices, which has dropped from 70$ at the beginning of 2020 to 20$ at the end of April. Second, the COVID Emergency has also caused a reallocation of consumption between different categories, with a drop of expenditure for tourism, trips and accommodation and an increase in consumption of household goods as food and equipment to work, study and do sports at home. Finally, the huge job losses, the rise of unemployment and a lesser supply of goods and services in response to an increased demand caused an economic recession and led to higher inflation.
According to the forecasts of economists, inflation in February should have represented the peak of the price trend. However, the war could cause a higher inflation rate in the next months. But how much higher? According to analysts, it has not reached its peak yet, but it is near. The data on the US March inflation will be published in April, before Easter, and the rise of energetic products will weigh on it, considering that during March gas price has touched the all-time high of 4,3 $ per gallon and it will impact the measurements of March.
There is a huge difference between the inflation we are observing in the US and the one in Europe. The American inflation comes from the combined effect of higher demand and lower supply; therefore, if the FED takes action, it can affect the demand and control the inflationary spiral. In Europe, on the other hand, inflation comes in particular from energy prices, the bottleneck of international trade and supply chains. Consequently, the ECB monetary policy cannot do much, as Lagarde claimed: “Currently, ECB does not have the same tools as the FED to slow down prices”. Also, the inflationary spill-over effects on America and Europe will be completely different: after the shell oil boom, the US are independent as regards the energetic profile, while this is not the case for the US. In this context, stagflation becomes a scenario more and more likely for Europe. In favor of the FED there is also another factor: some inflation components can be resized through the rate hike as, for example, the rental prices or the car prices, while in Europe the inflation depends largely on higher energy price, on which rates have a little impact.
FED strategies (and mistakes) during Great Depression, Great Recession, Covid
During periods of crisis like the actual one, the central bank role becomes essential to fight the markets uncertainty and the investors’ and workers’ fear in general. Nevertheless, the FED strategies and plans have not been so successful and sometimes FED presidents themselves recognized this afterwards.
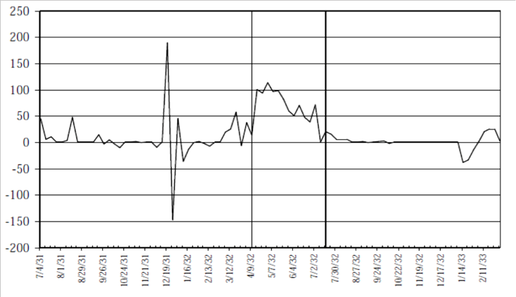
Looking at the past failed strategies of the FED, one of the earliest examples was during the Great Depression in the US in 1929-1930, a period in which the financial crisis caused a violent shock that eroded the trust in the banking system and in the Federal Reserve System. On that occasion, the FED performance was criticized because the System was unable to avoid or at least to limit the economic implications caused by the fall of the stock market. Moreover, through its activity, the FED prolonged and exacerbated the crisis. According to experts, the FED mistake was to allow monetary inflation and credit expansion during the 1920's, which led the entrepreneurs to invest more and become less risk averse. However, the main defect was the restrictive monetary policy taken to rein in the stock market, put in place starting from 1927. The Federal Reserve thus failed in the face of its first challenge; it did not prove it could use monetary policy to prevent and avoid the fall of all US economic activity.
In front of the paralysis of the market caused by the financial crisis in 2007-08, the FED learnt from its past mistakes and acted as ‘Lender of Last Resort’ by surrogating the market through unconventional measures: for example, the bank started selling treasuries to buy less liquid assets with the aim of providing liquidity to the markets that needed it. Nevertheless, as former FED president Ben Bernanke admitted, that during the Great Financial Crisis policy makers made some mistakes in fighting the crisis: for example they did not foresee that the crisis would have arrived with that strength causing massive economic damage, moreover, in Bernanke’s opinion, the FED was too slow in putting in place the program for the securities purchase, the famous Quantitative Easing (QE).
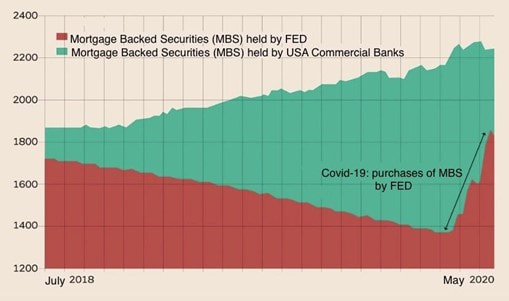
Since late February 2020, when the fear of contagions of Coronavirus out from China had increased, the FED took action rapidly and massively to stop the disastrous economic repercussions caused by the pandemic. After two snips of interest rates for an amount of 150 basis points, the central bank launched a balance sheet expansion: in three months, total assets in the FED portfolio turned from 4158 to 7097 billion dollars, with an increase of 70%. This massive increase is due to the classic QE, with the program of purchase of treasuries and Mortgage Backed Securities (MBS) and to the central bank liquidity swaps with foreign central banks. Together, QE and liquidity swaps represent the 93% of all enlargements in the budget surplus put in place by the FED since late February 2020. The remaining 7% includes repos to support liquidity on the domestic interbank market and various lending instruments. In short, there was a huge effort to support the world’s largest economic power dealing with one of the worst financial crises in history.
Since late February 2020, when the fear of contagions of Coronavirus out from China had increased, the FED took action rapidly and massively to stop the disastrous economic repercussions caused by the pandemic. After two snips of interest rates for an amount of 150 basis points, the central bank launched a balance sheet expansion: in three months, total assets in the FED portfolio turned from 4158 to 7097 billion dollars, with an increase of 70%. This massive increase is due to the classic QE, with the program of purchase of treasuries and Mortgage Backed Securities (MBS) and to the central bank liquidity swaps with foreign central banks. Together, QE and liquidity swaps represent the 93% of all enlargements in the budget surplus put in place by the FED since late February 2020. The remaining 7% includes repos to support liquidity on the domestic interbank market and various lending instruments. In short, there was a huge effort to support the world’s largest economic power dealing with one of the worst financial crises in history.
Bond Market Reaction
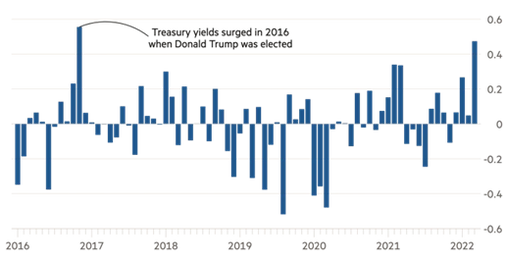
Treasury yields are particularly important since they set the floor for borrowing costs across the economy and are commonly used in financial models that investors use to value assets. For instance, the 10-Year Treasury Yield commonly serves as a benchmark for the cost of borrowing for firms interested in financing long-term projects and for individuals interested in getting a housing mortgage.
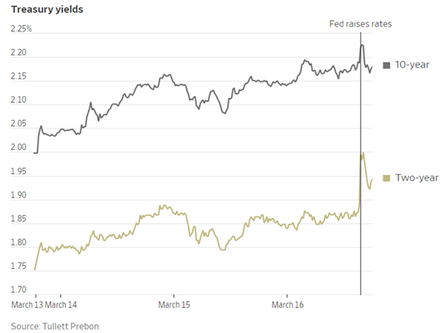
In the Fed Funds market, following the last FOMC meeting in January, members of the committee had decided to maintain the target range at 0-25 bp, with the effective fed funds rate being near the lower bound at around 8bp. Expectations regarding the future short-term rates set by the Fed can cause changes in yields and have a direct effect on the economy even before the announcements. The day before the FOMC meeting, the yield on the 10-year U.S. Treasury note increased to 2.14%, a record high since 2019 and surprisingly approximately four times higher than its low point during the pandemic in 2020. Moments before the announcement, the yield was up by 2 basis points that day, standing at 2.187%.
In a nutshell, after the central bank meeting, short-term Treasury yields rose, partially also because investors had been betting that the Fed Reserve would signal more caution in its forecasts, whereas longer-term yields were relatively flat. Analysts consider Wall Street’s reaction to be consistent with the recent trends since investors showed readiness to adjust their interest-rate expectations for 2022 and a significant inflexibility beyond that point.
By the end of the FOMC meeting, the yield on the two-year Treasury note, which moves closely with interest rate expectations, had increased to 1.956% from 1.855% the day before. This is rather significant given that it has swung dramatically this month, having increased by 1.03 percentage points in March, marking its largest monthly increase since April 2004. Moreover, the yield on the 10-year note only increased slightly to 2.185% from 2.160% the day before, marking its highest level since May 2019 and remaining roughly unchanged from just before the Fed statement. Finally, the yield on the 30-year bond dropped to 2.456% from 2.503% the day before.
Regarding the yield curve, we can see that there has been a significant increase in the majority of the yields, and the slope and shape of the curve changed drastically. With higher yields at short-term bonds, the yield curve has flattened, a move most commonly measured as a reduction in the spread between 2- and 10-year yields. Additionally, the gap between 5- and 30-year yields has significantly narrowed to the lowest it has been since 2007. After monetary tightening, the inversion of the yield curve has historically proved to predict a recession in the future, and the flattening of the curve points to a potential slowdown of the US economy.
It is also important to note that the Bloomberg U.S. Treasury Index has lost 5.55% since Dec 31, which would mark the highest quarterly decline since that of 5.45% at the start of 1980, which could potentially highlight the degree to which some investors have underestimated the aggressiveness of the central bank’s intentions regarding getting inflation into check.
Stock Market Reaction
During the months leading up to the FOMC March meeting, investors’ fears regarding the Federal Reserve’s policy decisions to address inflation and the recent geopolitical developments of the invasion of Ukraine by Russia brought the broad stock market into correction and the Nasdaq even approached bear territory.
Regarding the major US stock markets averages the day before the FOMC meeting, the S&P 500 was standing at 11.1% below its peak and the Dow Jones remained at 8.85% below its January 4 record. Moreover, Nasdaq had fallen by 19.4% from its November 19t record, given that the increasing interest rates have impacted growth stock valuations significantly.
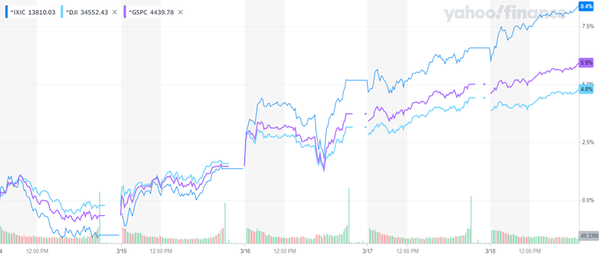
Moments before the announcement by the Federal Reserve’s Chair Jerome Powell, the S&P500 was up 1.2%, the Dow Jones Industrial Average was up by 238 points (0.7%) and the Nasdaq Composite was up 2.1% that day. These movements can also partially be attributed to optimistic news regarding the developments of the negotiations between Ukraine and Russia and the signalling from Beijing that it would start rolling back its broad regulatory crackdown.
The Dow Jones Industrial Average climbed 518.76 points, or 1.5%, to 34,063.10 after dropping about 100 points following the release of the Fed’s statement. Similarly, the S&P 500 added 2.2% to 4,357.86, and the Nasdaq Composite gained 3.7% to 13,436.55, after turning red for a few hours following the announcement.
Regarding specific industries and companies, during the announcements of Fed Chairman Jerome Powell, major technology companies’ stocks increased significantly, with Meta Platforms going up by nearly 4%, Amazon and Netflix gaining more than 2%, Microsoft jumping 0.7% and Apple increased by 1.4%. Afterwards, Micron Technology was among the best-performing S&P 500 stocks, increasing by 8.9%, while Starbucks grew by 5.1% and Boeing advanced by 5%. Moreover, bank shares gained from the overall optimism coming from higher rates, with JPMorgan increasing by 4.4% and Bank of America jumping 3.1%. Regarding the foreign stock markets, optimism continued in Asia, with the Nikkei opening approximately 3% higher and Hang Seng opening 6.6% higher, continuing its 9% increase from the previous day.
Even though interest rate hikes usually lead to drops in the stock market, since higher interest rates represent higher borrowing costs for individuals and firms, thus decreasing overall spending, this does not seem to be the case this time since all of the major US stock indexes closed at a higher value. This can potentially be attributed to the fact that many investors interpreted the interest hike as a signal of the strength of the economy in the long term (due to its ability to withstand monetary tightening) and the Fed’s preparedness to take quick action to combat the highest level of inflation in decades.
Two weeks after the announcement (on March 31st), the S&P 500 is currently up by 5.39%, DIJA has increased by 3.02%, and the Nasdaq Composite index has jumped 7.21%. In the future, the plan of the Fed to reduce its balance sheet through quantitative tightening could negatively impact the stock market, due to its sensitivity to such policy changes. The last time the Fed attempted QT was in 2017, which pushed the stock market to bear-market territory in 2018, however, the Fed signaled retreat in early 2019 with interest rate cuts and additional bond purchases.
Conclusion
It is yet to understand if the FED will able to cool down the economy without causing a recession. The strategy of Washington seemed complicated enough before the explosion of the war in Ukraine. Now these new events pose a further threat on price stability, in particular on the side of supply. Tighter energy supply will have the effect of putting European economies between a rock and a hard place. Balancing the recent recovery and avoiding an inflationary spiral will be a tough challenge for central bankers in Frankfurt, and uncertainty will undoubtably expand to the US. The market has reacted positively to Powell's statements so far, although a recession seems more likely every day. Only the future will tell what will happen. We will watch closely what the FED will do untill the next FOMC meeting on May 4.
Sources
by
Elena di Ceglie
Lorenzo Borriello
Stergios Mastoris
Even though interest rate hikes usually lead to drops in the stock market, since higher interest rates represent higher borrowing costs for individuals and firms, thus decreasing overall spending, this does not seem to be the case this time since all of the major US stock indexes closed at a higher value. This can potentially be attributed to the fact that many investors interpreted the interest hike as a signal of the strength of the economy in the long term (due to its ability to withstand monetary tightening) and the Fed’s preparedness to take quick action to combat the highest level of inflation in decades.
Two weeks after the announcement (on March 31st), the S&P 500 is currently up by 5.39%, DIJA has increased by 3.02%, and the Nasdaq Composite index has jumped 7.21%. In the future, the plan of the Fed to reduce its balance sheet through quantitative tightening could negatively impact the stock market, due to its sensitivity to such policy changes. The last time the Fed attempted QT was in 2017, which pushed the stock market to bear-market territory in 2018, however, the Fed signaled retreat in early 2019 with interest rate cuts and additional bond purchases.
Conclusion
It is yet to understand if the FED will able to cool down the economy without causing a recession. The strategy of Washington seemed complicated enough before the explosion of the war in Ukraine. Now these new events pose a further threat on price stability, in particular on the side of supply. Tighter energy supply will have the effect of putting European economies between a rock and a hard place. Balancing the recent recovery and avoiding an inflationary spiral will be a tough challenge for central bankers in Frankfurt, and uncertainty will undoubtably expand to the US. The market has reacted positively to Powell's statements so far, although a recession seems more likely every day. Only the future will tell what will happen. We will watch closely what the FED will do untill the next FOMC meeting on May 4.
Sources
- Bloomberg
- Il Sole 24 Ore
- MilanoFinanza
- Fortune
- Economist
- FT
- US Bureau of Labor Statistics
- WSJ
- Yahooo Finance
- Federal Reserve
by
Elena di Ceglie
Lorenzo Borriello
Stergios Mastoris
