In this article we want to present an asset allocation model that has gained a lot of momentum in the last decades. We will present how Risk Budgeting works and how its employed to construct portfolios in which all assets contribute the same amount of risk to the overall portfolio risk. After introducing the concept, we will present a short casestudy from this year’s market downturn to highlight one of the biggest weaknesses of the strategy.
Over twenty years ago, people at Bridgewater Associates asked themselves the question:” What mix of assets has the best chance of delivering good returns over time through all economic environments?”. The main. Criticism formulated by the team about traditional asset allocation approaches was the heavy concentration to one or two asset classes. This exposed the portfolio inevitably to certain economic scenarios in which these asset classes would perform well, a problem even diversification in those asset classes cannot really address. The Bridgewater Team therefore broke down the question to different economic scenarios that influenced the performance of asset classes in different ways and building on this they distributed these effects equally among all economic scenarios. According to them, the determining economic factors are expected growth and expected inflation.
Applying this framework to different asset classes is very simple. If inflation is going to be lower than expected and at the same time economic growth is lower than excepted, bringing about lower interest rates than assumed, plain vanilla Bonds as an aggregate would do better than stocks or inflation protected Bonds. On the opposite, with higher growth and higher inflation, inflation protected Bonds and Commodities would do especially well. So far this is not to surprising, but what Bridgewater added to this framework now was risk parity, in that they created a portfolio in which they allocated 25% of portfolio risk to each of these economic scenarios. This resulted in the so-called All-Weather Fund that is still managed by Bridgewater and has been copied many, many times over the years. Over the years also lots of variations were sold to investors, where, for example, risk was spread among different factor ETFs or leverage was applied to reach certain target variances (as in the case of Bridgewater’s All-Weather Fund).
One reason this strategy attracted so many copy-cats is that it is easy to come up with your very own risk parity portfolio, as we shall see in this part. So how does on actually calculate the portfolio weights? Starting out with portfolio risk as
with w as the vector of portfolio weights, and V as the Variance-Covariance matrix of all assets in the portfolio. This means that the marginal risk contribution of each asset is represented by
Leading to the individual risk contribution to be represented by its weight and the marginal risk contribution
Applying this at a portfolio level requires us to calculate the vector with all the weights. Luckily, we can use least squares optimization to arrive at the optimal portfolio weights by minimizing each assets risk contribution in relation to the others
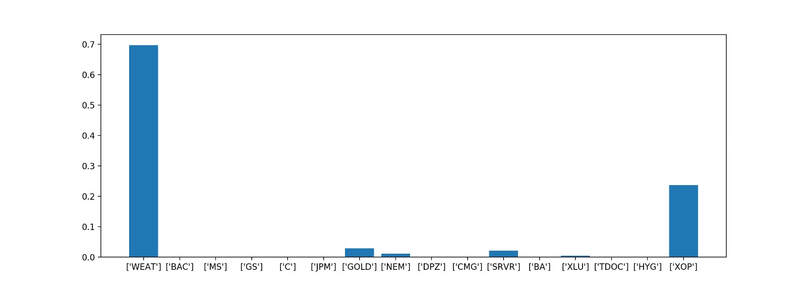
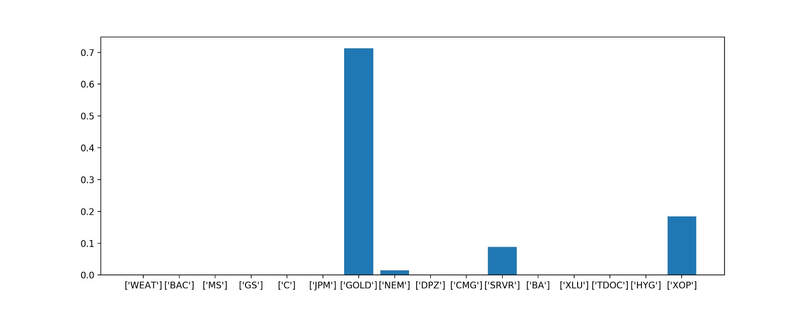
As we saw, a central component of the portfolio is the Variance-Covariance Matrix. Unfortunately this is also where the weak point of this allocation model lays, since those values are mainly taken from historical data and therefore have no validity for the future. To illustrate how massively the allocation can shift, we calculated to hypothetical risk parity portfolios for a number of tickers before and after the Covid-19 downturn.
This also means that at the beginning of the year, during the large scale sell-offs in the market, Risk Parity portfolios suffered a lot, since suddenly asset correlation changed and the portfolios became highly unbalanced. Investors suffered additionally, since most of the portfolios are levered to achieve certain target volatilities.
Overall, the Risk Parity approach provides an interesting alternative to classical asset allocations, especially since the concept is very intuitive and even more so when its complemented by a lot of additional work, like in the case of Bridgewater. However, we saw that even the most sophisticated strategies do underperform from time to time.
Tobias Schmidt
Want to keep up with our most recent articles? Subscribe to our weekly newsletter here.


